Troubleshooting#
Something not working? No problem — you can find systematic help here. The vast majority of errors in i-doit can be quickly narrowed down and resolved with the right information. This article helps you find the cause, reach the appropriate solution in the Knowledge Base, and — if necessary — write a meaningful bug report.
Quick check: Where to find clues?#
Before diving into the details, take a look at these four information sources. In most cases, at least one of them provides the decisive clue.
i-doit log files#
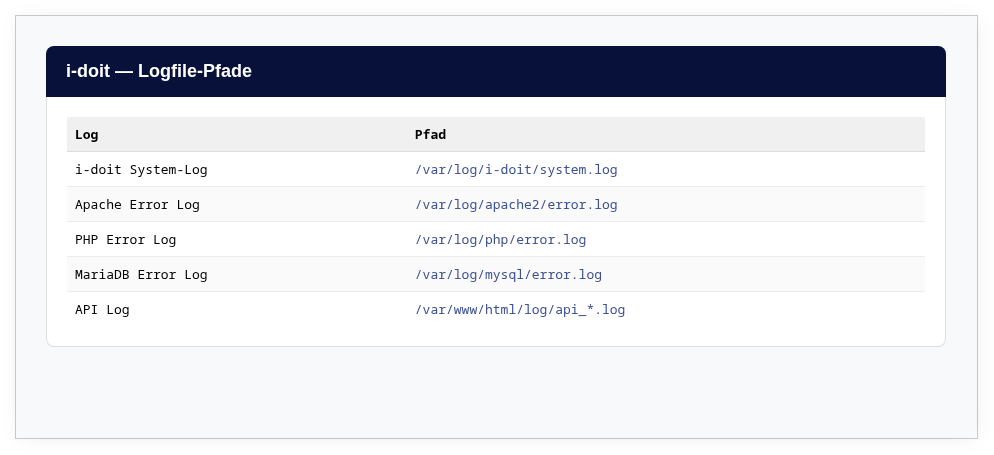
All i-doit-specific logs are located in the installation directory under log/. The most important files:
| File | Content |
|---|---|
log/exception.log | PHP exceptions — the most common starting point for error messages in the interface. Enable under Administration → [Tenant Name] Administration → Settings → Logging → Exception Log. |
log/system.log | General system messages from i-doit |
log/ldap_debug.log | LDAP connection and sync log (when ldap.debug is enabled) |
log/import_*.log | Import logs for CSV, JDisc, and other imports |
Monitor log files in real time
Open a terminal and use tail -f /path/to/idoit/log/exception.log. Then perform the faulty action in i-doit — the error appears immediately in the terminal.
Some log channels must first be enabled. You can find the settings under Administration → [Tenant Name] Administration → Settings for [Tenant Name] → Logging. The higher the log level (Debug is the highest), the more details you receive.
PHP and web server error log#
Not every error is logged by i-doit itself. PHP errors and fatal crashes end up in the web server's error log:
- Debian/Ubuntu (Apache):
/var/log/apache2/error.log - RHEL/Rocky (Apache):
/var/log/httpd/error_log - Nginx:
/var/log/nginx/error.log
Browser developer console#
If an action in the web interface does not work (button does not respond, dialog does not open, list remains empty), the browser console often provides the decisive clue. Open it with F12 or Ctrl + Shift + I (macOS: Cmd + Option + I). Errors are marked in red. A detailed guide can be found further below in the section Developer console in the browser.
Operating system logs#
Sometimes the problem is not with i-doit but with the web server, the database, or the operating system itself. On GNU/Linux, the following helps:
1 2 3 4 5 6 | |
Check whether the Apache and MySQL/MariaDB processes are consuming unusually high CPU time or memory.
Problems by symptom#
i-doit does not start or shows a white page#
A white page (White Screen of Death) or an HTTP 500 error almost always indicates a PHP problem. First check the PHP error log of the web server (see above). Common causes:
- PHP version not compatible — check the system requirements for your i-doit version.
- PHP memory limit too low —
memory_limitinphp.inishould be at least256M. - File permissions incorrectly set — the web server user (e.g.,
www-data) must have read and write permissions on the entire installation directory. - Database not reachable — see the Database errors section below.
Login does not work#
If you cannot log in, there are several possible causes:
- "Lost link to database" — the database connection is interrupted. Detailed help can be found in the article "Lost link to database".
- Session timeout incorrectly configured — a value that is too low can cause you to be logged out immediately after logging in. Read No login after changing the session timeout.
- LDAP problems — if LDAP users cannot log in, check the LDAP configuration and the debug log. For TLS connections, the article LDAP via TLS helps.
- Admin Center login — the Admin Center uses separate credentials. If the password is forgotten, it can only be reset via the CLI tool. See Admin Center.
Performance problems#
i-doit is responding slowly, pages take forever to load, saving takes minutes? Then check:
- System load — is the CPU or memory at its limit? (
htop,free -h) - Database size — very large tenant databases benefit from regular system repair and cleanup. This function cleans up orphaned entries and optimizes tables.
- MariaDB configuration — the settings
innodb_buffer_pool_sizeandinnodb_log_file_sizehave a major impact on performance. Refer to our system settings. - PHP OPcache — make sure the OPcache is enabled and has sufficient memory.
- Network — with remote databases, latency can be the cause.
Database errors#
Database problems are among the most common sources of errors. Here are the most important scenarios and their solution articles:
| Symptom | Article |
|---|---|
| Error message "MySQL-Server has gone away" | "MySQL-Server has gone away" — usually max_allowed_packet is configured too low. |
| MySQL/MariaDB does not start after configuration change | MySQL/MariaDB does not start — frequently occurs after changing innodb_log_file_size. |
| "Lost link to database" at login | "Lost link to database" — the database connection is interrupted or the credentials are incorrect. |
| "Row size too large" during update | Row size too large — a table has exceeded the maximum row size of InnoDB. |
| "Can't create table (errno: 140)" | Can't create table — occurs when restoring a SQL dump if the row format does not match. |
| Database corruption (crashes, broken tables) | MariaDB Database Corruption — repairing damaged InnoDB tables. |
Check database health
The System Repair and Cleanup function checks database integrity and can automatically fix many inconsistencies.
Update problems#
If an update fails or errors occur after the update, you can find a maintained list of known problems with workarounds in Known Update Problems. Also check:
- Were the system requirements for the new version met?
- Was a complete backup created before the update? If so, you can restore in an emergency.
- Are hotfixes available for the new version?
Location problems#
If you cannot save in the Location category, there is usually an inconsistency in the location hierarchy. The article Location cannot be saved shows you how to find and fix the cause.
LDAP problems#
LDAP connections via TLS are known to be error-prone. The article LDAP via TLS lists the most common causes and solutions. Also enable the LDAP debug log (ldap.debug in the Expert Settings) to trace the communication with the LDAP server in detail.
Useful tools for troubleshooting#
In addition to the log files, several tools are available within i-doit itself:
- Logbook — Every change to objects is recorded in the logbook. If data has disappeared or changed, the logbook shows you who changed what and when.
- System Repair and Cleanup — Checks the database for inconsistencies and repairs them. Particularly helpful after imports, migrations, or when i-doit behaves "strangely".
- i-doit environment info file — In the Admin Center under Home → Actions, you can download an XML file with all system settings. This file is invaluable for support.
- FAQ — Frequently asked questions with answers.
- Hotfixes — Already published fixes for known bugs.
Before you contact support#
If you cannot solve the problem yourself, help us help you quickly. Gather the following information before writing to us — this way we avoid time-consuming follow-up questions:
Required information#
- Versions — Which version of i-doit, affected add-ons, PHP, Apache/Nginx, and MariaDB/MySQL are you using? The easiest way: download the i-doit environment info file from the Admin Center and attach it.
- Error description — What exactly happens? What did you expect? What happened instead?
- Reproduction steps — Which steps lead to the error? Can the error be reliably reproduced?
- Error message in plain text — Copy the error message as text (not just as a screenshot) so we can search for it.
Very helpful#
- Log files — Relevant excerpts from
exception.log, the PHP error log, or the syslog. - Screenshots — Of the error message in the interface and, if applicable, from the browser developer console.
- Timestamp — When did the error first occur? Was anything changed beforehand (update, import, configuration change)?
Contact options#
If you have a support contract, you already have the necessary contact information. Bugs can also be reported without a support contract via the Customer Portal or the Help Portal.
You do not need to format the bug report beautifully or embed it in glossy PDFs. A friendly, factual tone and the information mentioned above are perfectly sufficient.
We will get back to you#
For customers with a support contract, we get back to you within a short time — often with a suggested solution. We try to reproduce the error on our test systems based on your information.
If the error is confirmed, we fix it as quickly as possible. Before delivery, every fix goes through our testing processes. Quality takes time. Afterwards, we publish the fix as part of our release cycles.
If you have tried a solution (fix, workaround, etc.), we appreciate your feedback:
- Did it work? Wonderful.
- Problem still persists? Then we will try alternative approaches.
- Follow-up errors occurred? No problem — we will go through the above steps again until everything works.
Opening and using the developer console in the browser#
For detailed error analysis in the web browser or for support requests by the i-doit team, it is often necessary to open the browser's developer console. This shows important information such as JavaScript errors, failed resource loading attempts, or details about network requests.
Step 1: Open the developer console#
Choose the instructions for your browser.
Google Chrome#
- Via keyboard shortcut (recommended):
F12orCtrl+Shift+I(macOS:Cmd+Option+I). - Via menu: Three-dot menu (
...) → More Tools → Developer Tools.
Mozilla Firefox#
- Via keyboard shortcut (recommended):
F12orCtrl+Shift+I(macOS:Cmd+Option+I). - Via menu: Hamburger menu (
≡) → More Tools → Web Developer Tools.
Microsoft Edge#
- Via keyboard shortcut (recommended):
F12orCtrl+Shift+I(macOS:Cmd+Option+I). - Via menu: Three-dot menu (
...) → More Tools → Developer Tools.
Apple Safari#
- Enable "Develop" menu (one-time): Menu bar → Safari → Settings... → Advanced → Check Show Develop menu in menu bar.
- Open console:
Cmd+Option+Ior via the Develop menu → Show Web Inspector.
Step 2: Gather relevant information for support#
After opening the developer tools, you will see various tabs. Depending on the type of problem, different information is relevant.
The "Console" tab#
When is this needed? Whenever an action in the i-doit interface does not work. For example: - A click on a button (e.g., "Save") has no effect. - A dialog window does not open or closes unexpectedly. - Lists or content are not loaded correctly.
How to provide the right information:
- Open the developer tools and switch to the Console tab.
- Clear all previous entries. Click the "crossed-out circle" icon or use the keyboard shortcut
Ctrl+L. This ensures that only the relevant errors are recorded. - Now perform the action in i-doit that causes the error.
- Look for new entries in the console. Errors are almost always marked in red and contain keywords such as
Error,Exception, orfailed. - Take a screenshot. Make sure the entire error message is visible. Sometimes you need to click small triangles (
▶) to expand the full error message. - Even better than a screenshot: Right-click on the error message and select "Copy as text" or a similar option. Paste this text into your support request.
The "Network" tab#
When is this needed? When actions take a very long time, loading bars do not disappear, or data seems to be lost after clicking "Save". This tab shows the communication between your browser and the i-doit server.
How to provide the right information:
- Open the developer tools and switch to the Network tab.
- Check the option Preserve log (or
Persist logs). This prevents the recording from being lost when the page is reloaded. - Clear the previous recording by clicking the "crossed-out circle" icon.
- Now perform the slow or faulty action in i-doit.
- Observe the list of requests. Look for rows that are marked in red or have a status code such as
404(not found),403(forbidden), or500(server error).- Tip: You can often filter the list by
XHRrequests, as these are responsible for dynamically loading data in i-doit.
- Tip: You can often filter the list by
- Click on the faulty request (the red row). A new window with details about this request opens to the right or below the list.
- In this detail window, switch to the Response tab. This often contains the exact error message from the i-doit server.
- Take a screenshot of this window that shows both the list of requests (with the red-marked row) and the details with the server's response.
The "Elements" tab#
When is this needed? This tab is less frequently needed. It is useful when there are problems with the display of content (e.g., a field is misplaced or not visible). Usually, i-doit support will specifically ask you to look here. You can use it to inspect the HTML and CSS structure of the page in real time.
Summary for i-doit support
A good error description is the key to a quick resolution. By following the steps above, you provide our support team with exactly the technical details needed for analysis.
- For functional errors: Send us the output from the Console.
- For loading problems or "silent" errors: Send us a screenshot of the Network tab, including the Response of the faulty entry.