Querying Data with Livestatus/NDOUtils#
With the monitoring interface, you compare the target documentation in i-doit with the actual status from your Network Monitoring. This way, you display live data directly in i-doit and evaluate them.
Interfaces#
The following interfaces are supported:
- NDOUtils (or IDOUtils) and
- checkmk Livestatus
for Nagios, checkmk, Icinga, and compatible forks.
Recommendation
checkmk Livestatus provides a very high-performance connection to network monitoring. Therefore, it is preferred over NDOUtils.
Basic Configuration#
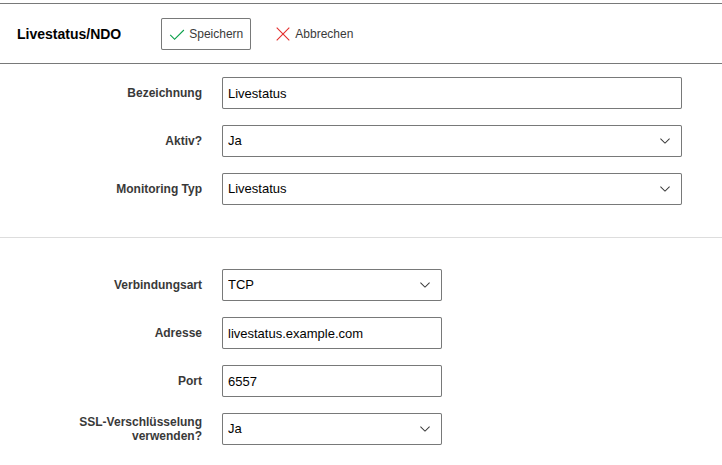
A running NDOUtils or checkmk Livestatus on your monitoring system is required. Configure access in i-doit under Administration → Import and Interfaces → Monitoring → Livestatus/NDO.
Livestatus supports TLS starting with i-doit 36
Livestatus example:
Setting Up Categories#
To set up the monitoring category:
- Assign the category folder Monitoring to the desired object types via Edit Data Structure.
- Configure the identification key for each object in the Monitoring category. You can use the object title, the hostname (with or without domain), or a freely chosen name.
- If using multiple monitoring instances, select the appropriate instance.
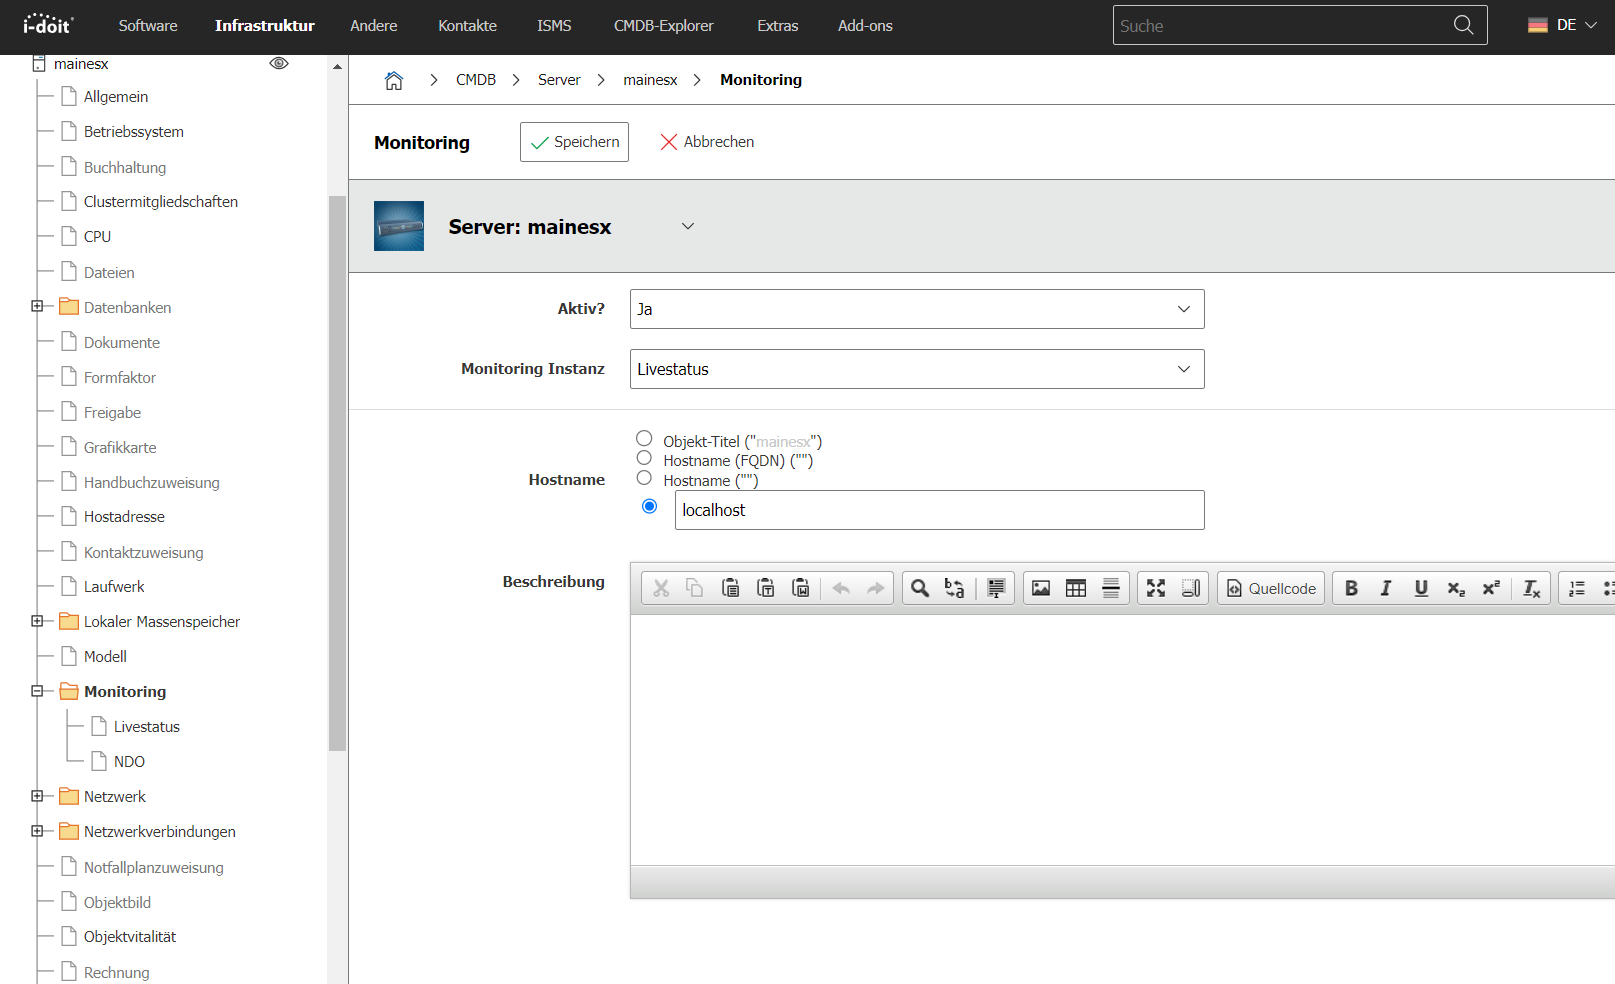
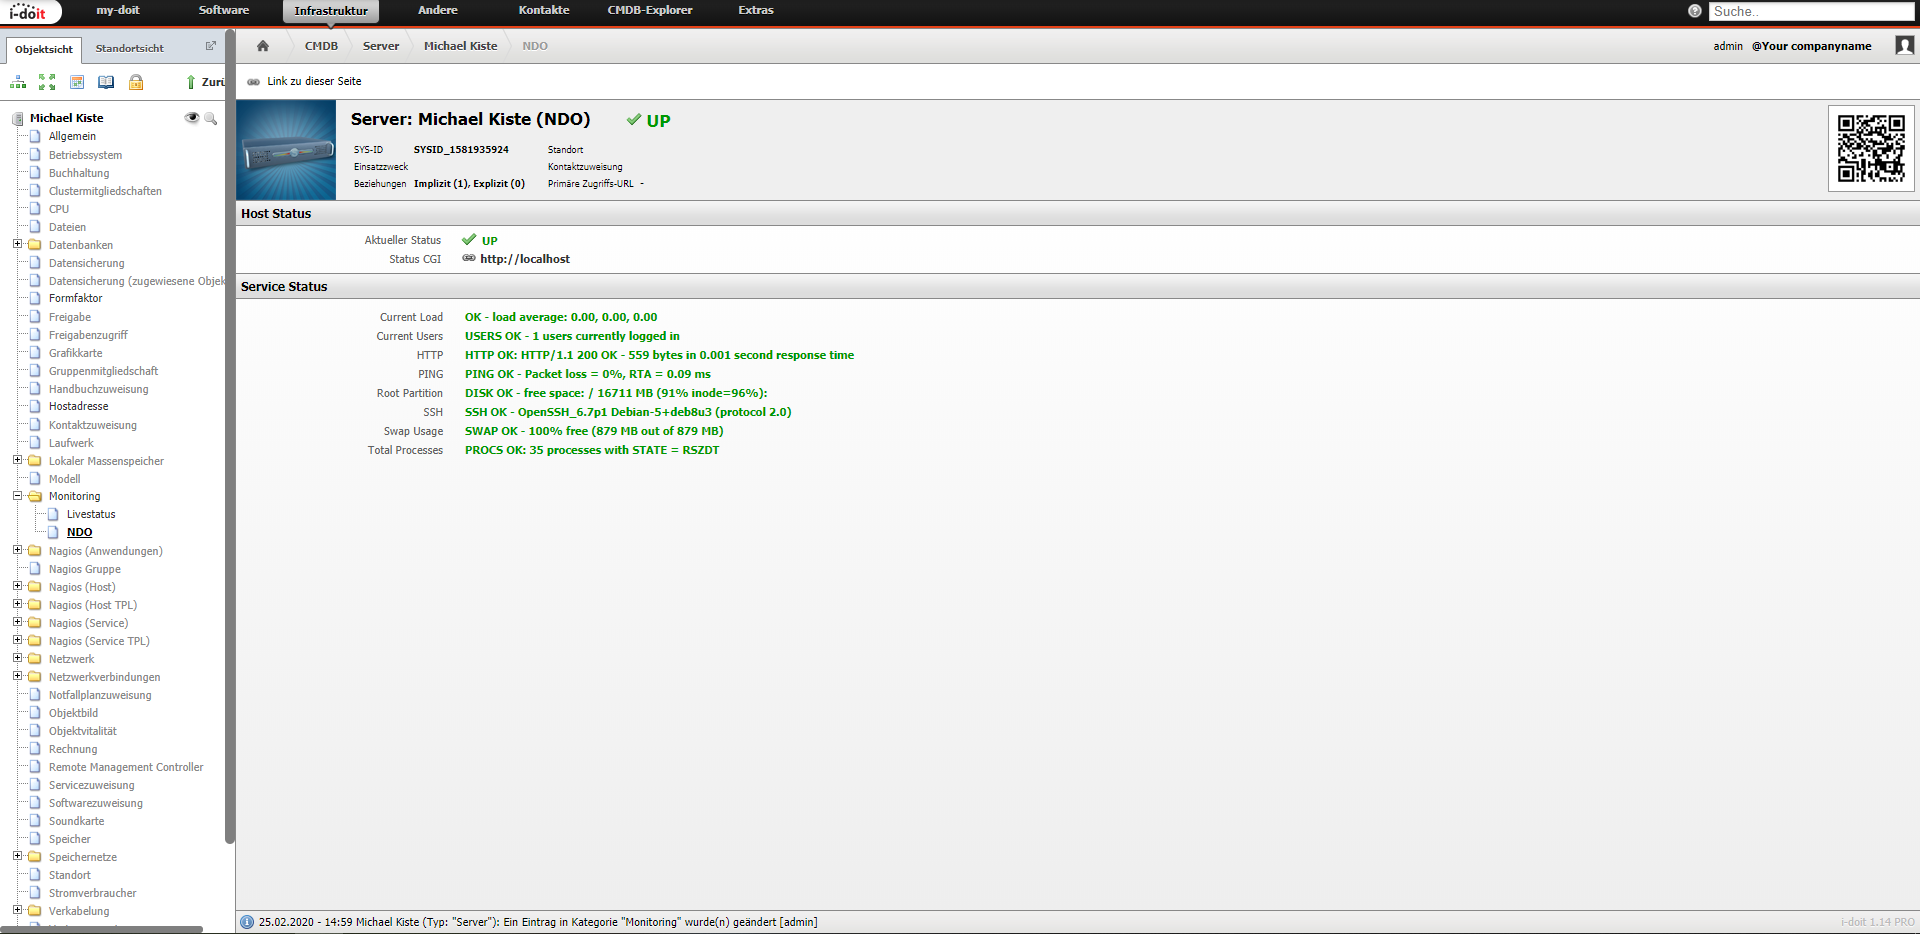
After activating and saving the category, you can query the current status in the Livestatus or NDO category.
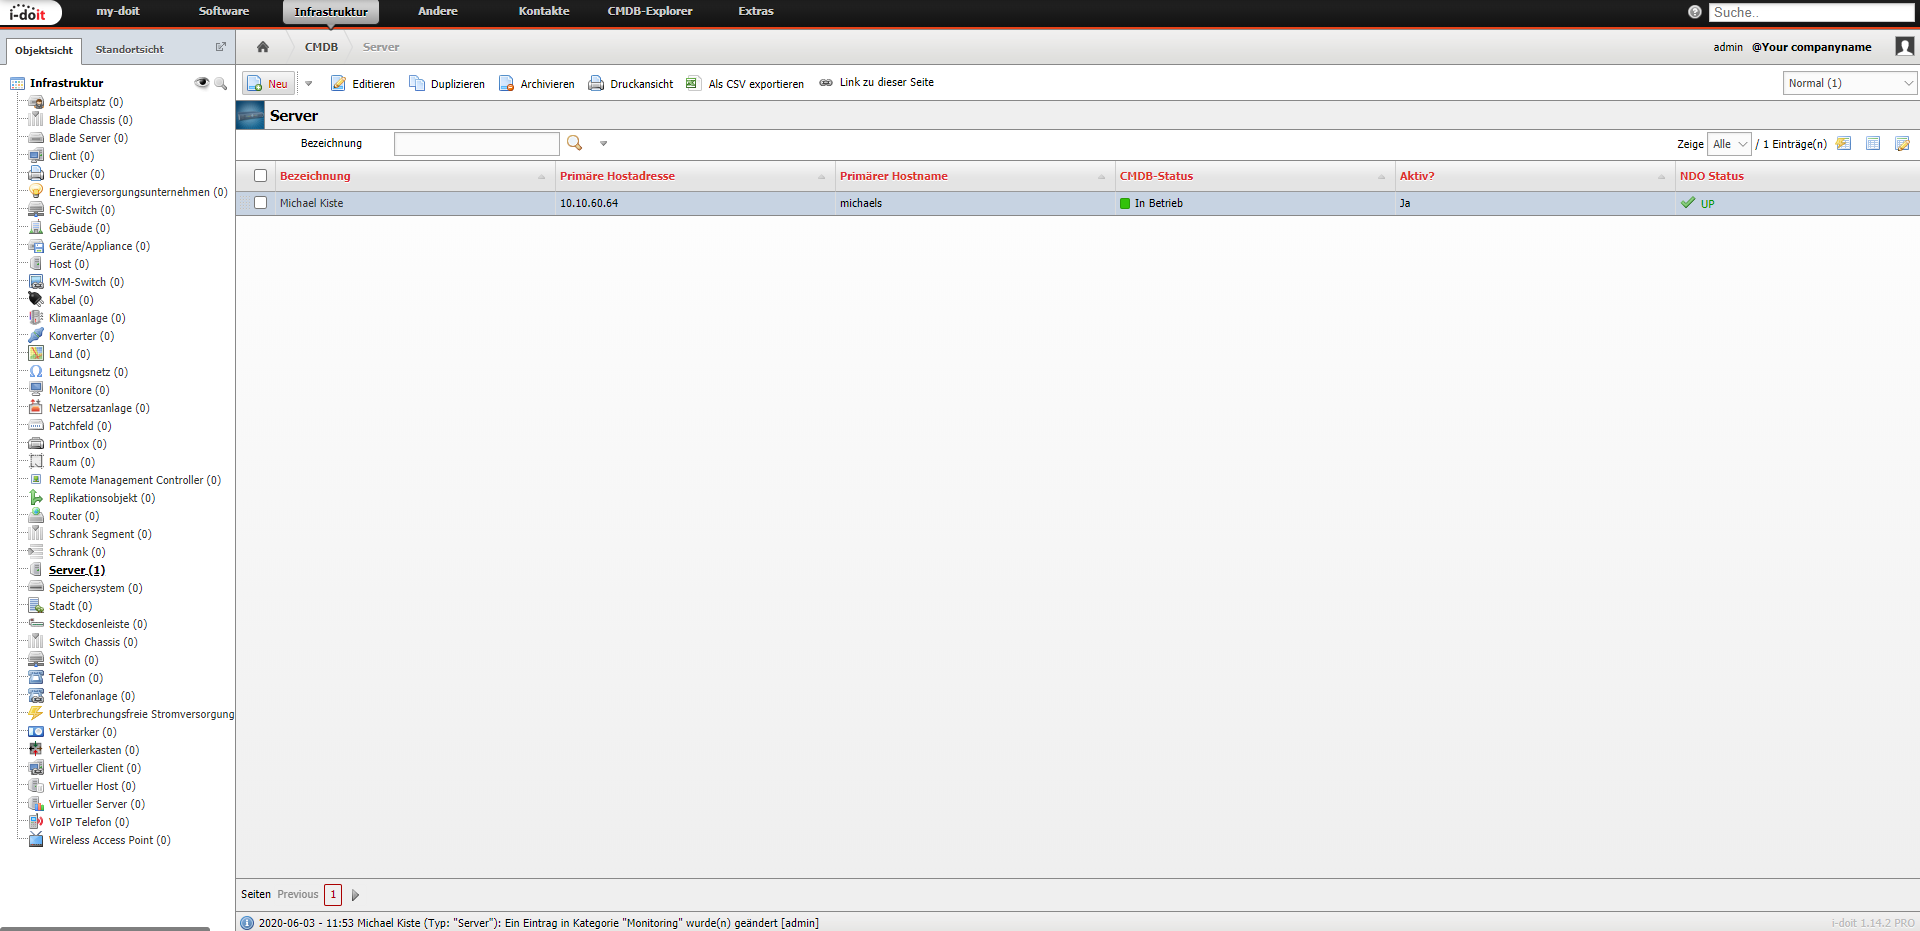
Additionally, you can add a column for NDO or Livestatus in the object list configuration to display the host status directly in the object list.
Logbook Entries from Monitoring#
With the i-doit console utility, you transfer status messages from monitoring into the logbook of i-doit. Call the nagios-ndoutils command for this -- it automatically transfers all status changes since the last run.