Dashboard and widgets#
The dashboard is your personal start page in i-doit, where you compile the most important information using widgets.
Each user has their own dashboard and can set up their individual view of the data. If you have put together a particularly good dashboard, you can define it as the default for everyone or assign it to individual users.
Access#
The dashboard appears automatically after logging in to i-doit. Alternatively, click on the  icon in the breadcrumb navigation or the i-doit logo in the upper left corner.
Available widgets#
Multiple selection
You can also place individual widgets on the dashboard multiple times, for example to display several reports.
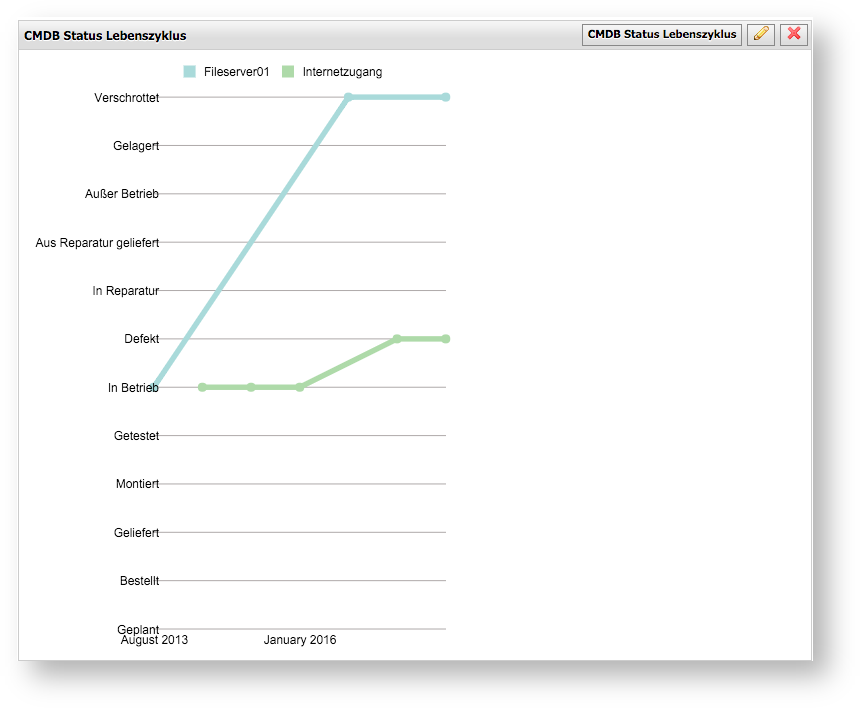
CMDB status life cycle#
You can select one or more objects via the pencil icon and display the status history in a graph.
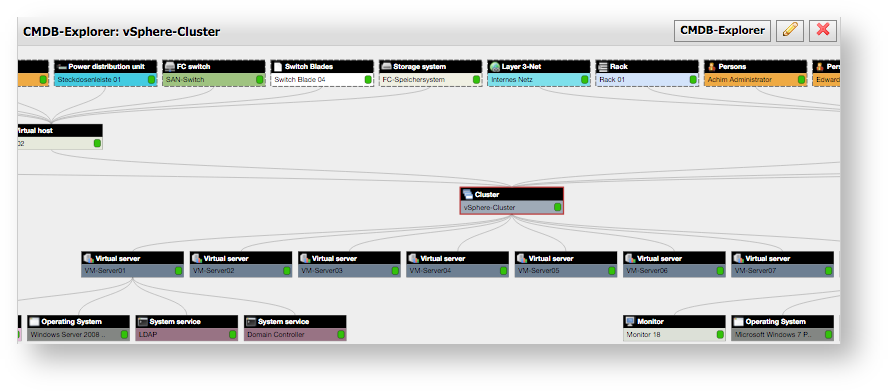
CMDB Explorer#
Here the regular CMDB Explorer can be displayed in a smaller variant without advanced features. To do this, an object must first be selected via the pencil icon, which is automatically loaded when the dashboard is opened.
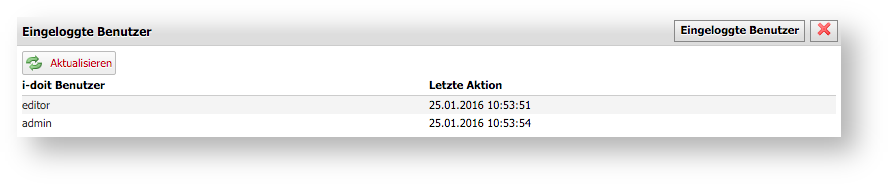
Logged-in users#
A list of all logged-in users is displayed.
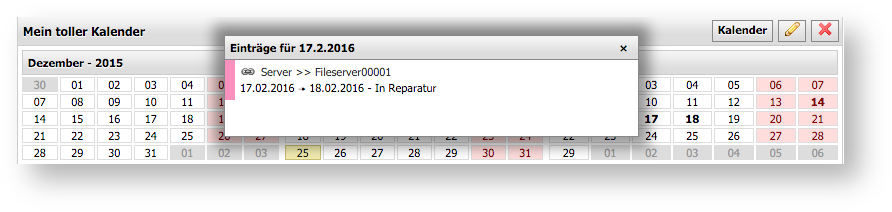
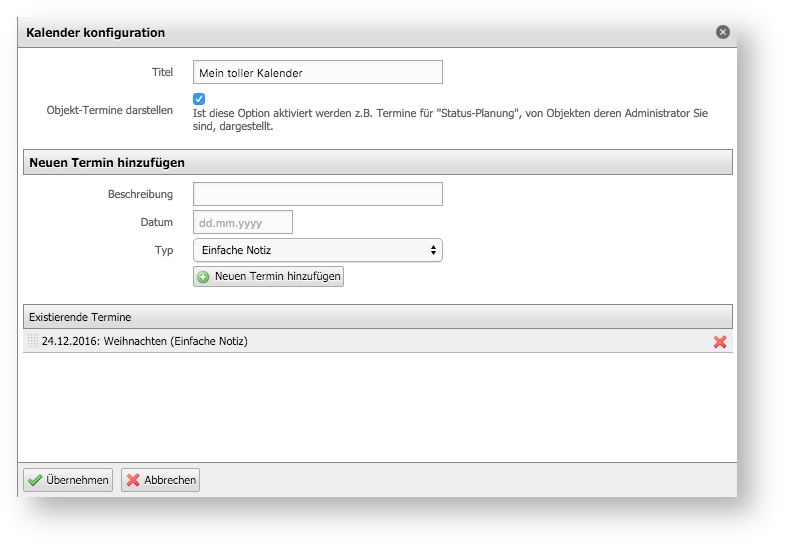
Calendar#
The calendar widget marks appointments in bold. To use this feature, the checkbox for considering object appointments such as status planning must be enabled via the pencil icon. It is mandatory to have the "Administrator" role for the respective object with a status plan in order for the calendar entry to be displayed.
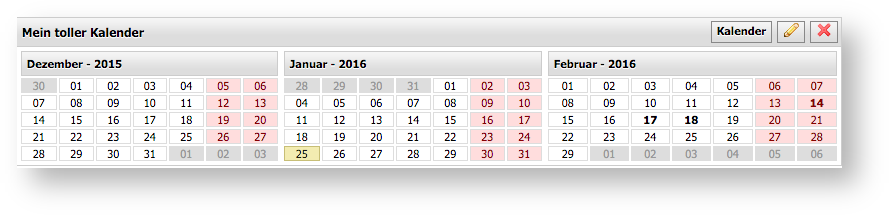
Alternatively, custom appointments can be defined via the widget settings, which will then appear in the calendar.
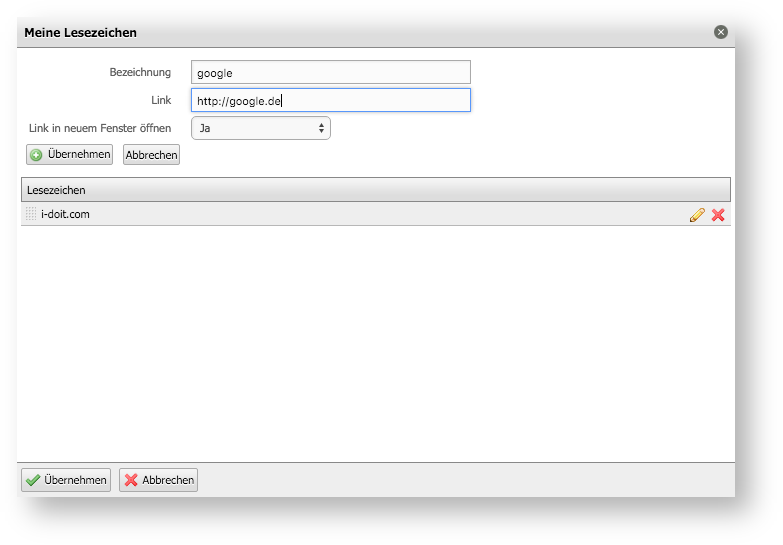
Bookmarks#
The bookmarks widget allows you to specify your own bookmarks for any addresses.
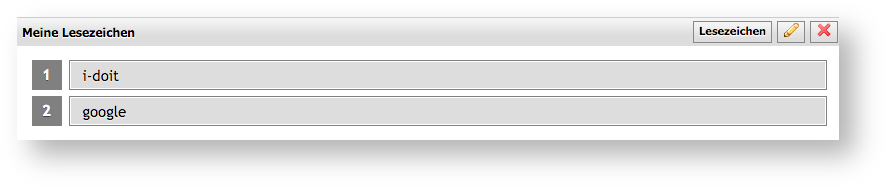
New links can be added using the pencil icon.
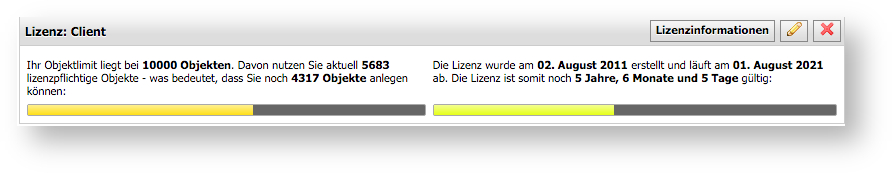
License#
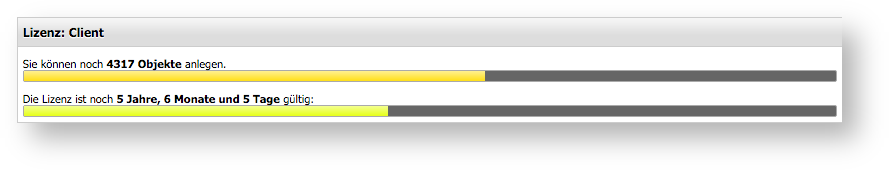
In the license widget you can view the current status of your i-doit license. By default, the horizontal variant with descriptive text is displayed.
In the configuration, accessible via the pencil icon, you can set up a vertical display with a compact form.
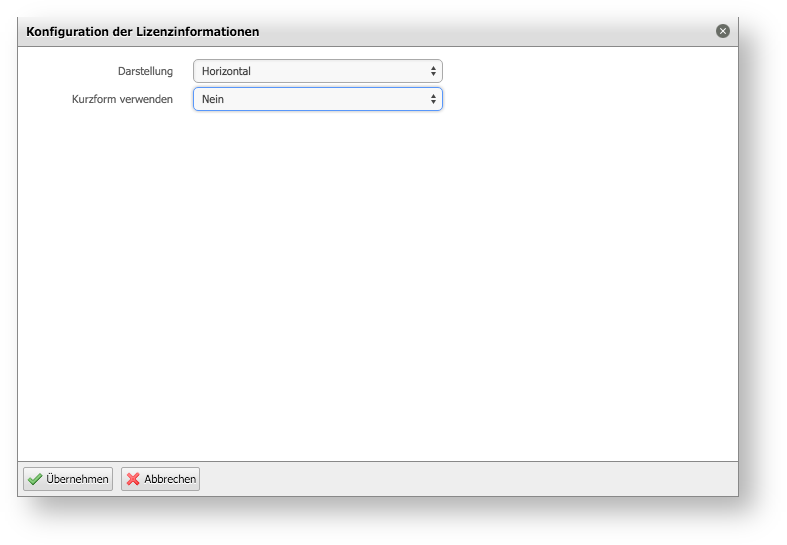
This compact form looks as follows:
My recently modified objects#
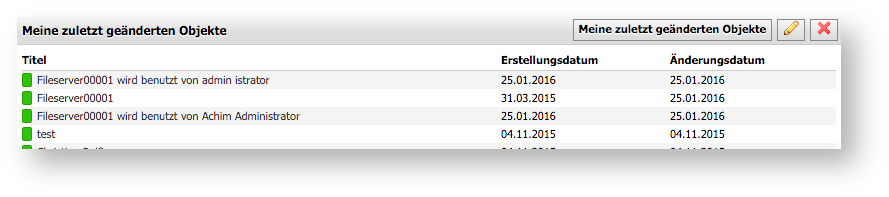
This widget displays the objects most recently modified by the logged-in user. The number of objects to display can be configured via the pencil icon. The default value is 25.
Monitoring: Endangered hosts#
This widget requires a connection to Nagios or Check_MK and displays a view of endangered hosts. A host can be selected for display via the pencil icon.
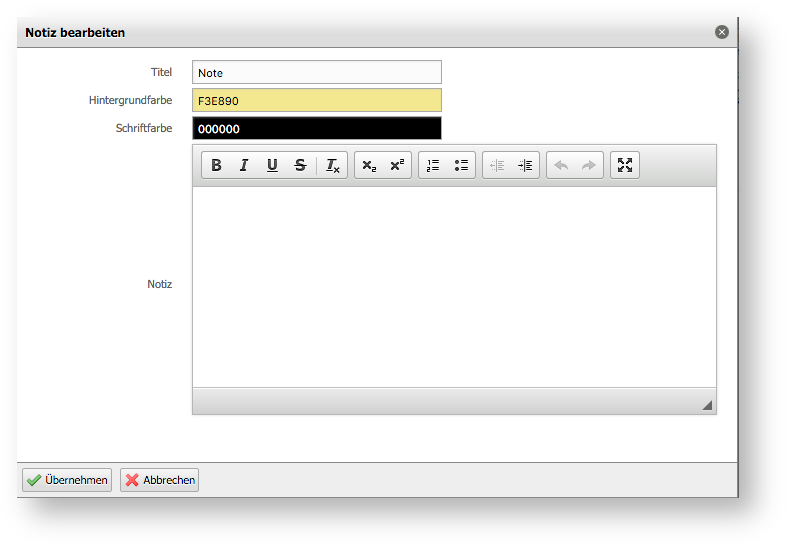
Notes#
With the notes widget you can place any text notes on the dashboard.
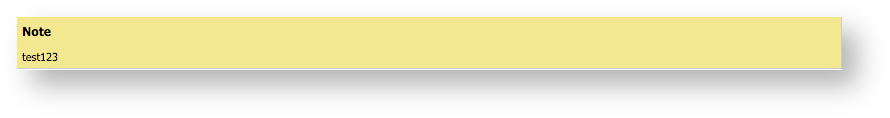
Notes are simply added or edited with a double-click.
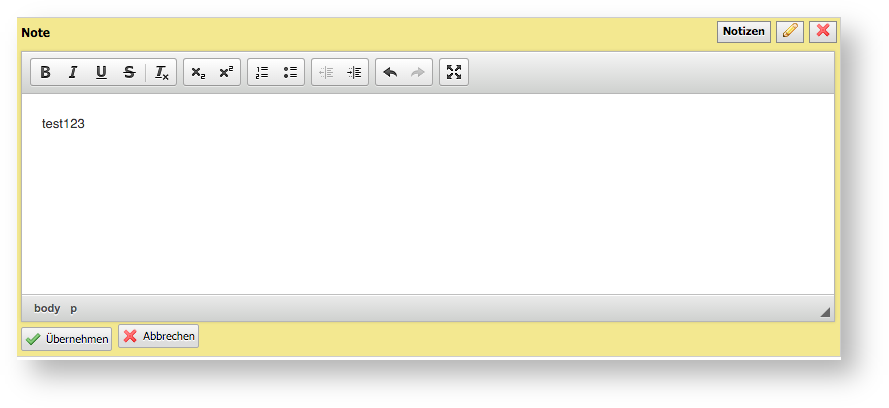
Via the pencil icon you can set up the title, background and font color, and edit the text.
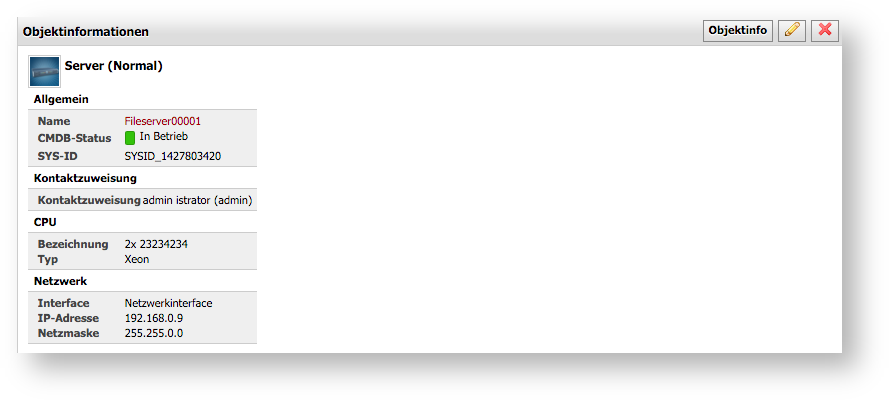
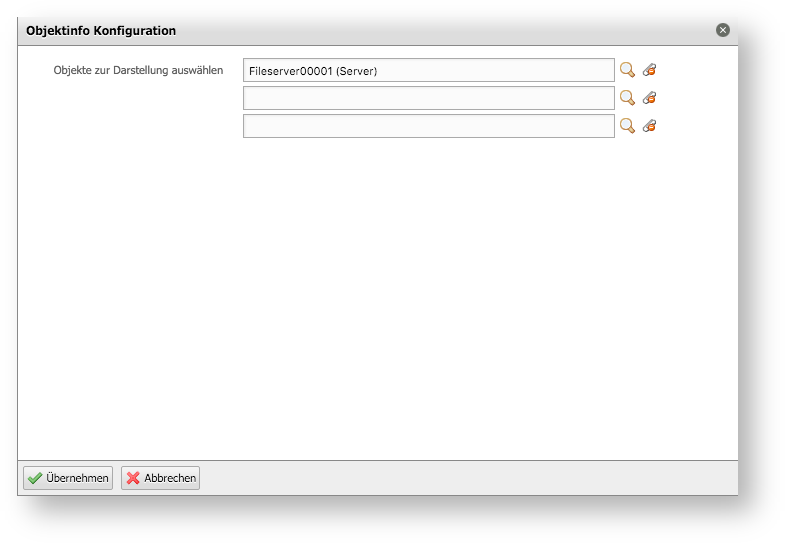
Object information#
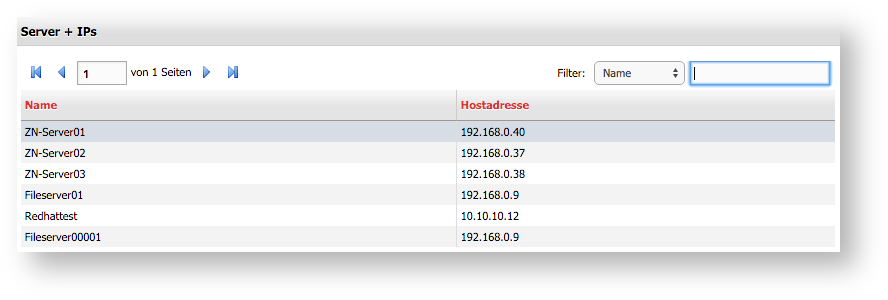
The widget displays a standard set of information for up to three objects configured via the pencil icon.
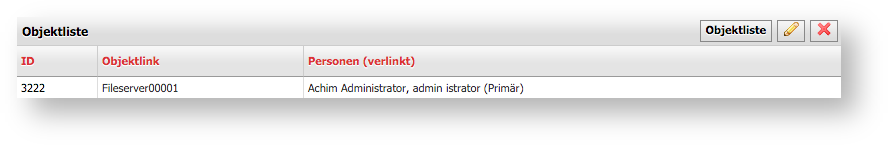
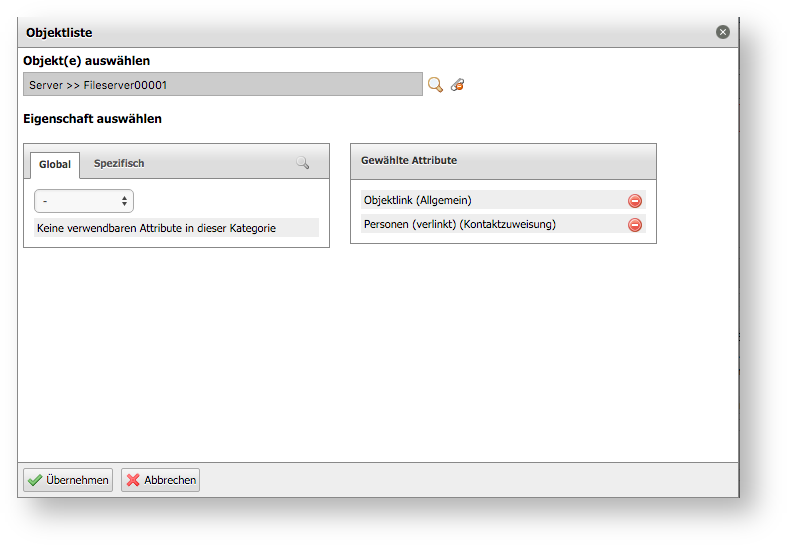
Object list#
Via the object list you can select one or more objects using the pencil icon and decide which attributes from the different categories should be displayed.
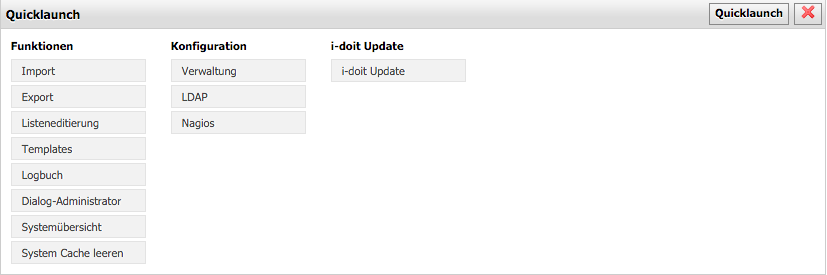
Quicklaunch#
This widget is a collection of frequently needed functions.
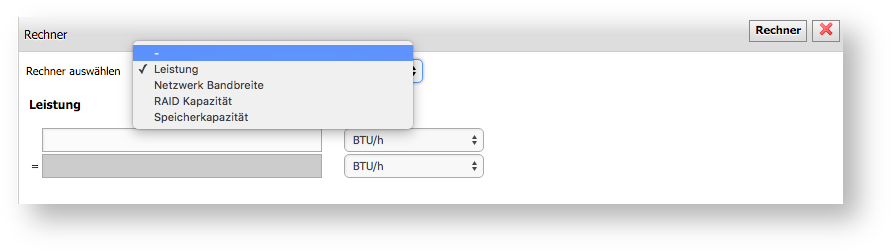
Calculator#
If you want to calculate performance, bandwidth, a RAID or storage capacity, the calculator widget is a suitable tool for your dashboard.
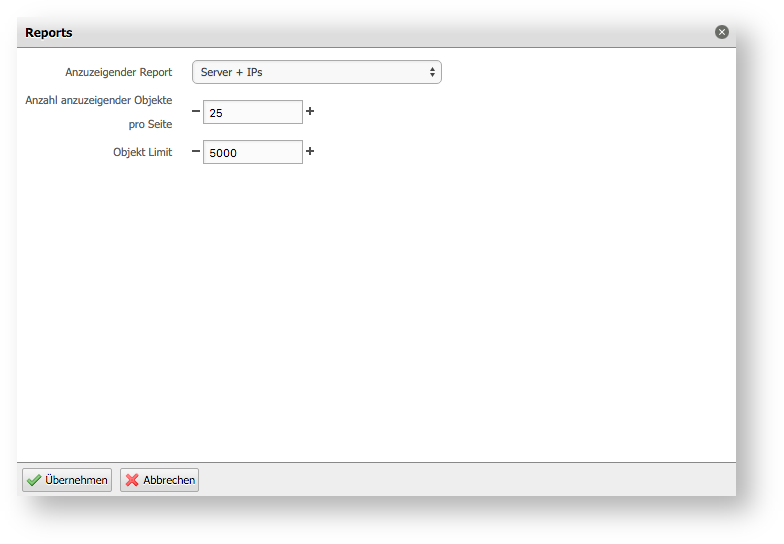
Report#
Any reports can be displayed in the report widget.
Via the pencil icon you can select a report and set limits. A limitation can benefit the dashboard's performance.
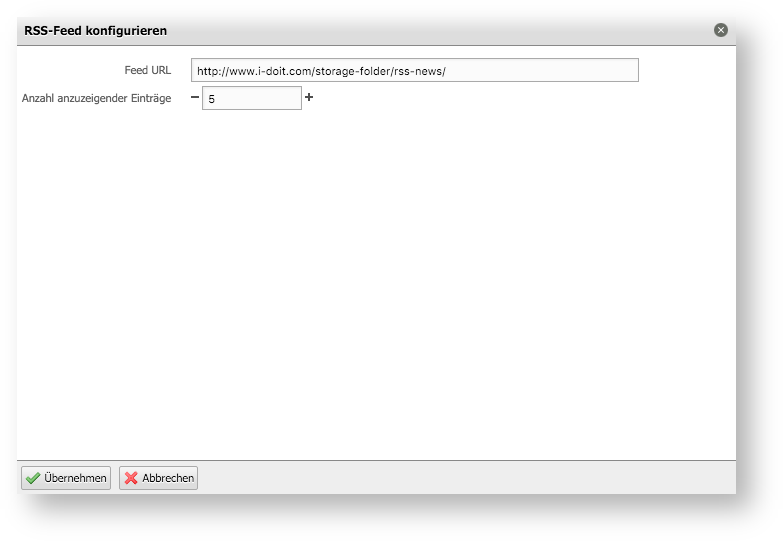
RSS feed#
The RSS feed widget allows you to integrate a feed into the dashboard.
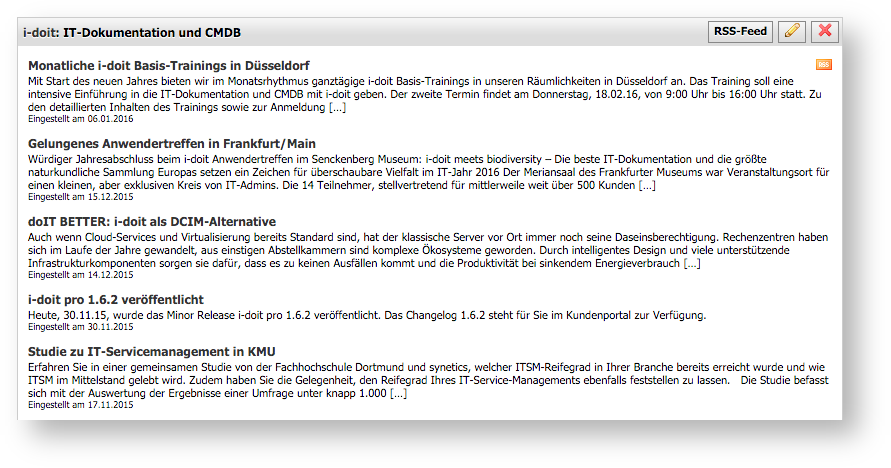
The address and the number of entries to display can be configured via the pencil icon.
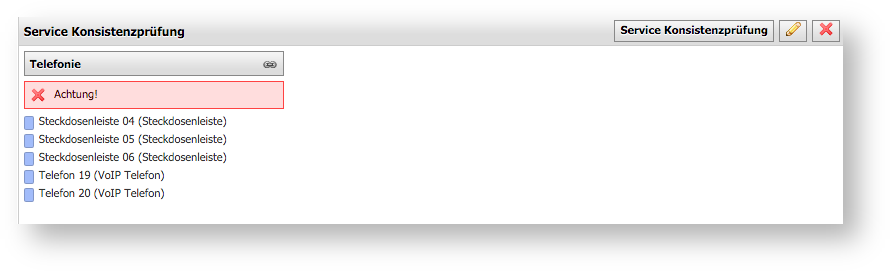
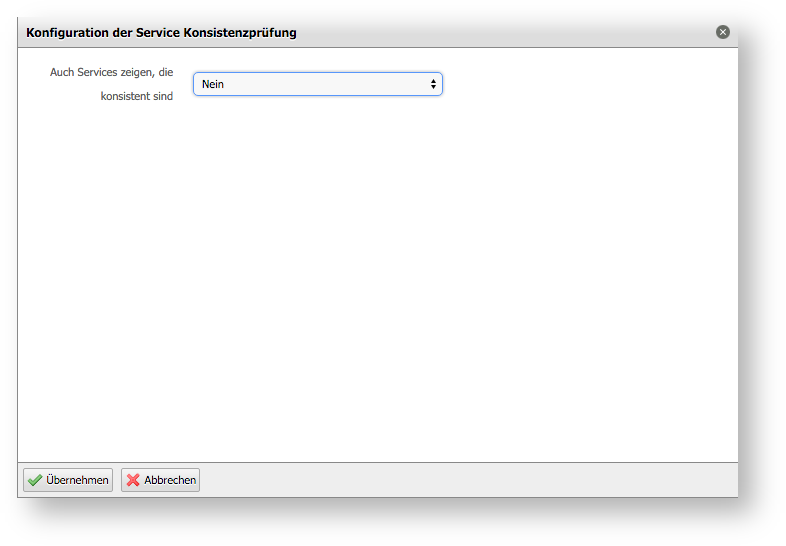
Service consistency check#
The consistency check examines whether objects that are part of a service have a status that could jeopardize the state of the service. In our example, all objects have the CMDB status "Stored", which is why the service above them may be at risk.
Note
Please note that with many services and many documented relationships, the performance of the dashboard may be affected.
In the configuration, consistent services can be shown.
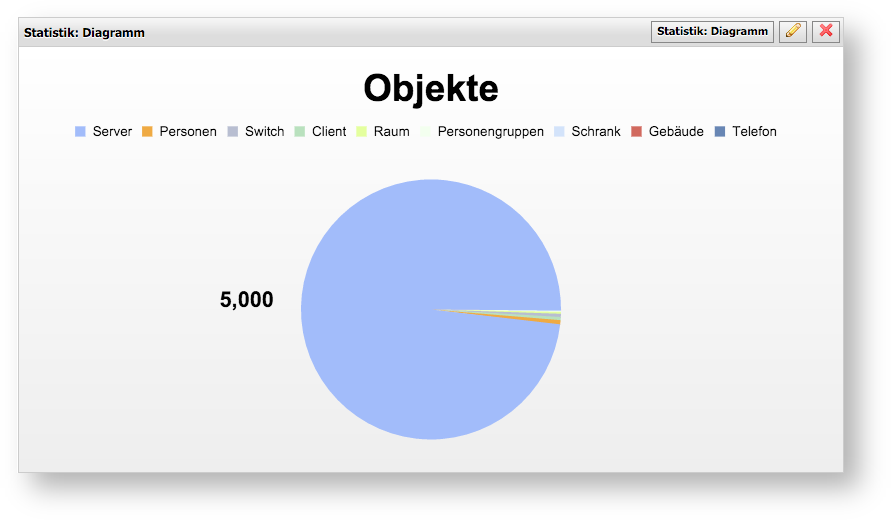
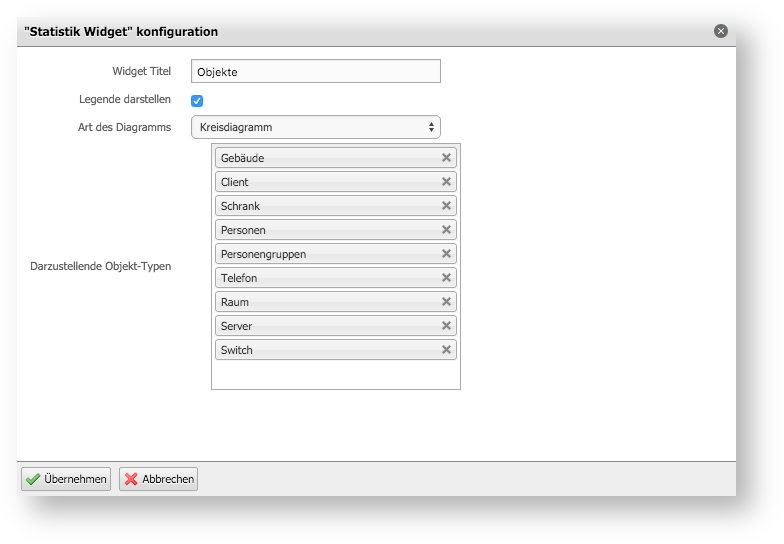
Statistics: Chart#
The statistics chart examines the object types configured via the pencil icon and displays them in one of many different presentation styles. In our example, it is a pie chart.
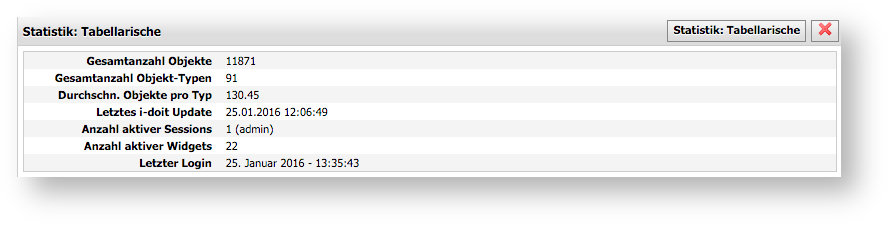
Statistics: Tabular#
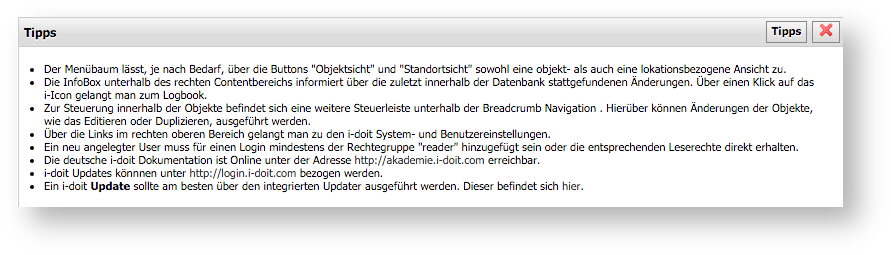
Tips#
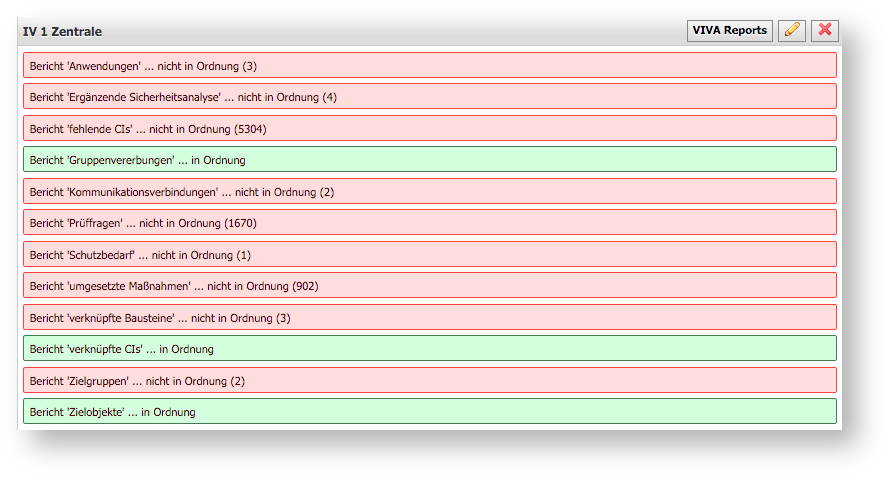
VIVA Reports#
These reports require the VIVA module to be installed and information domains to be documented. An information domain can be selected in the widget via the pencil icon.
Web browser#
This widget is a browser within the browser.
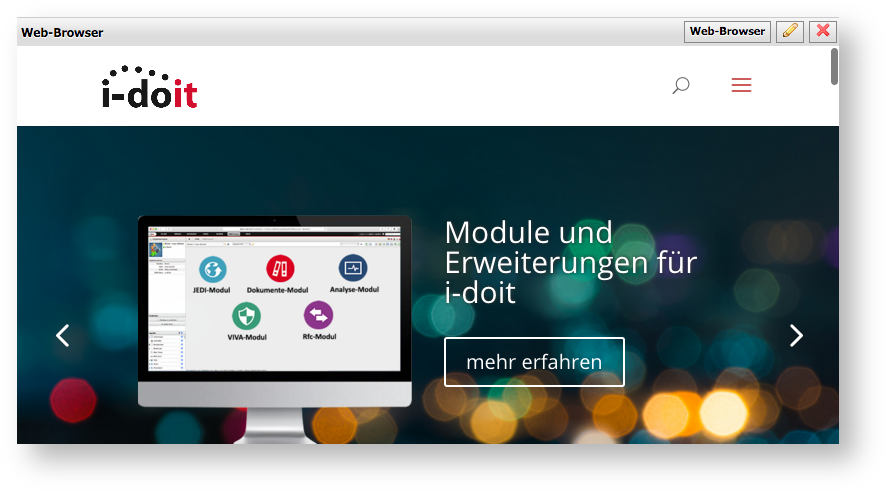
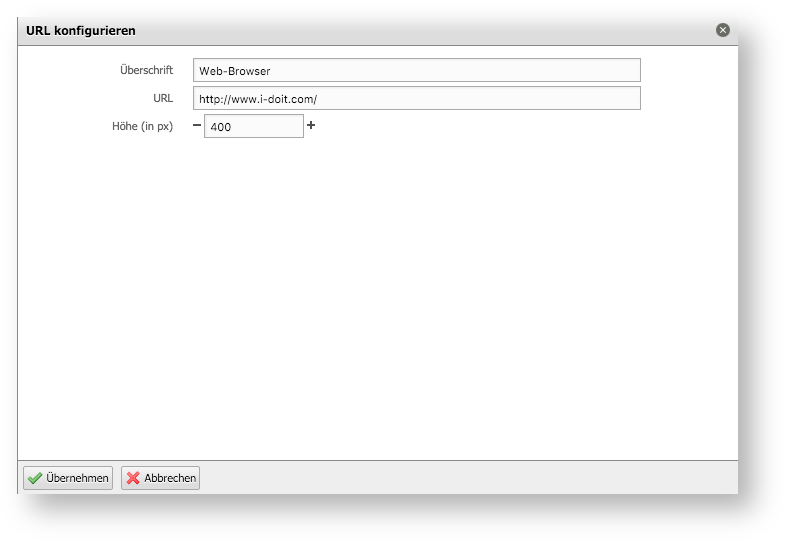
Via the pencil icon you can give the widget a title, specify a URL that is loaded when the dashboard is opened, and configure the height of the widget to properly display longer pages.
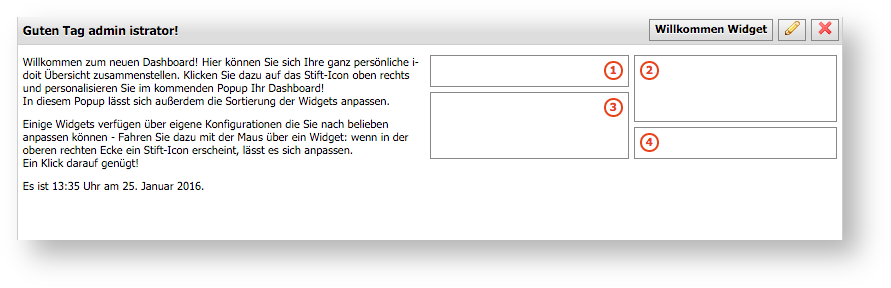
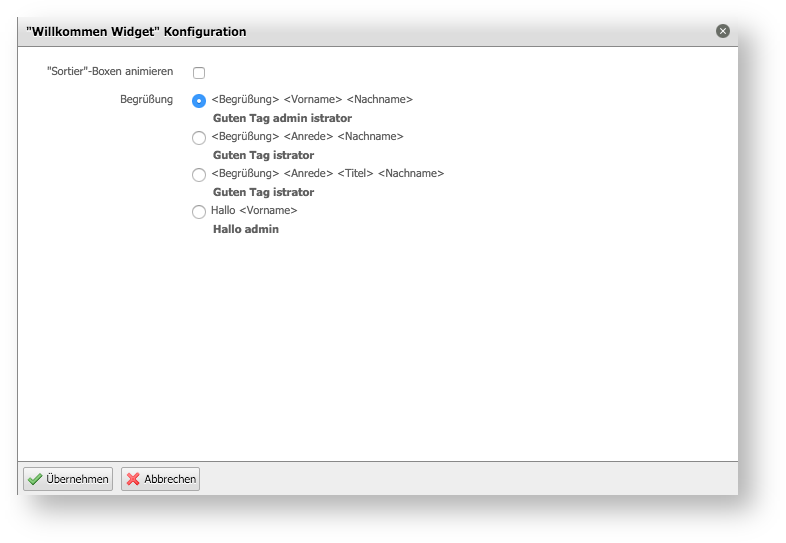
Welcome widget#
The widget greets you, depending on how it was configured via the pencil icon, and provides some helpful information about designing the dashboard. Here you can easily see how the widgets are arranged on the dashboard after selection.