Analysis#
The add-on Analysis offers you two key functions:
- Check data quality -- Examine how completely your IT documentation is filled in and receive an interactive results view.
- Simulate outages -- Run "what happens if" scenarios and analyze the impact on your infrastructure.
In combination with the interface to Checkmk, you can also investigate actual live outages directly.
Download and installation#
This add-on can be installed additionally. Details on download, installation, and updates can be found in the article "i-doit Add-ons".
Configuration#
No separate configuration is required.
Assigning rights#
Under Administration → Authorization system → Rights → Analysis, permissions for persons and person groups can be adjusted.
| Condition | Description |
|---|---|
| Analyses | Perform analyses |
| Manage data quality profiles | Create, edit, and/or irrevocably delete profiles for data quality |
Outage simulation#
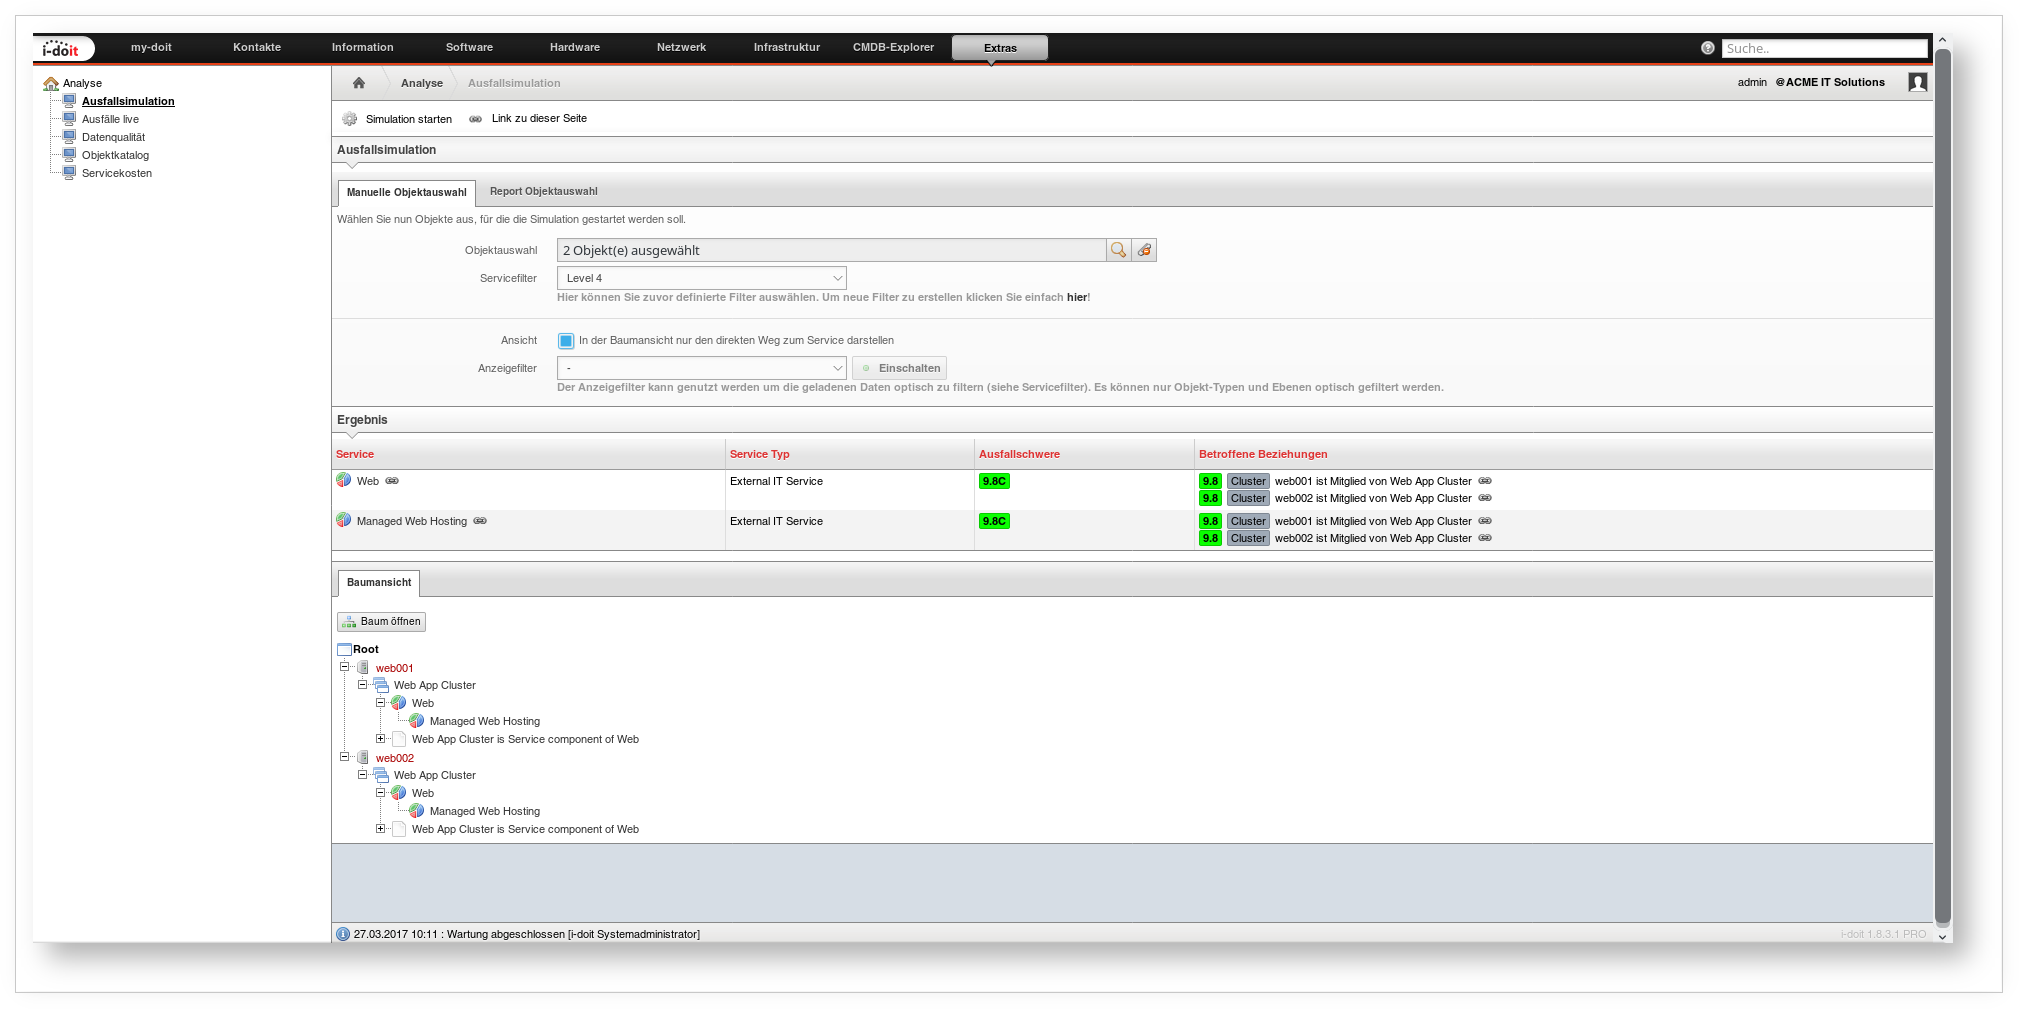
Would you like to find out what impact the failure of a specific object has on your documented services? Use the simulation under Extras → Analysis → Outage simulation. The following options are available via the Manual object selection tab:
| Option | Description |
|---|---|
| Object selection | Selection of one or more objects that have failed (or should be simulated as failed) |
| Service filter | Narrow the analysis to a specific depth, specific object types, relationships, etc.; the configuration is located under Extras → Services → Service filter. |
| View | Display the service tree in simplified form |
| Display filter | Subsequent filtering |
Click Start simulation to obtain the result. The result includes:
- A list of affected services -- depending on the service filter, also parent services in the hierarchy.
- Per service, an outage severity, displayed in color from green (minor) to red (severe). This is based on the weighting of the object relationships.
- A C after the value indicates that the failed object is part of a cluster.
Under Tree view, the outage is visualized as a service tree.
Via the Report object selection tab, you can alternatively select the objects based on a report.
Live outages#
Under Extras → Analysis → Live outages, i-doit accesses the interface to a configured network monitoring system (e.g., Checkmk). If a host actually fails, you can see directly what impact this outage has on your documented services.
Data quality#
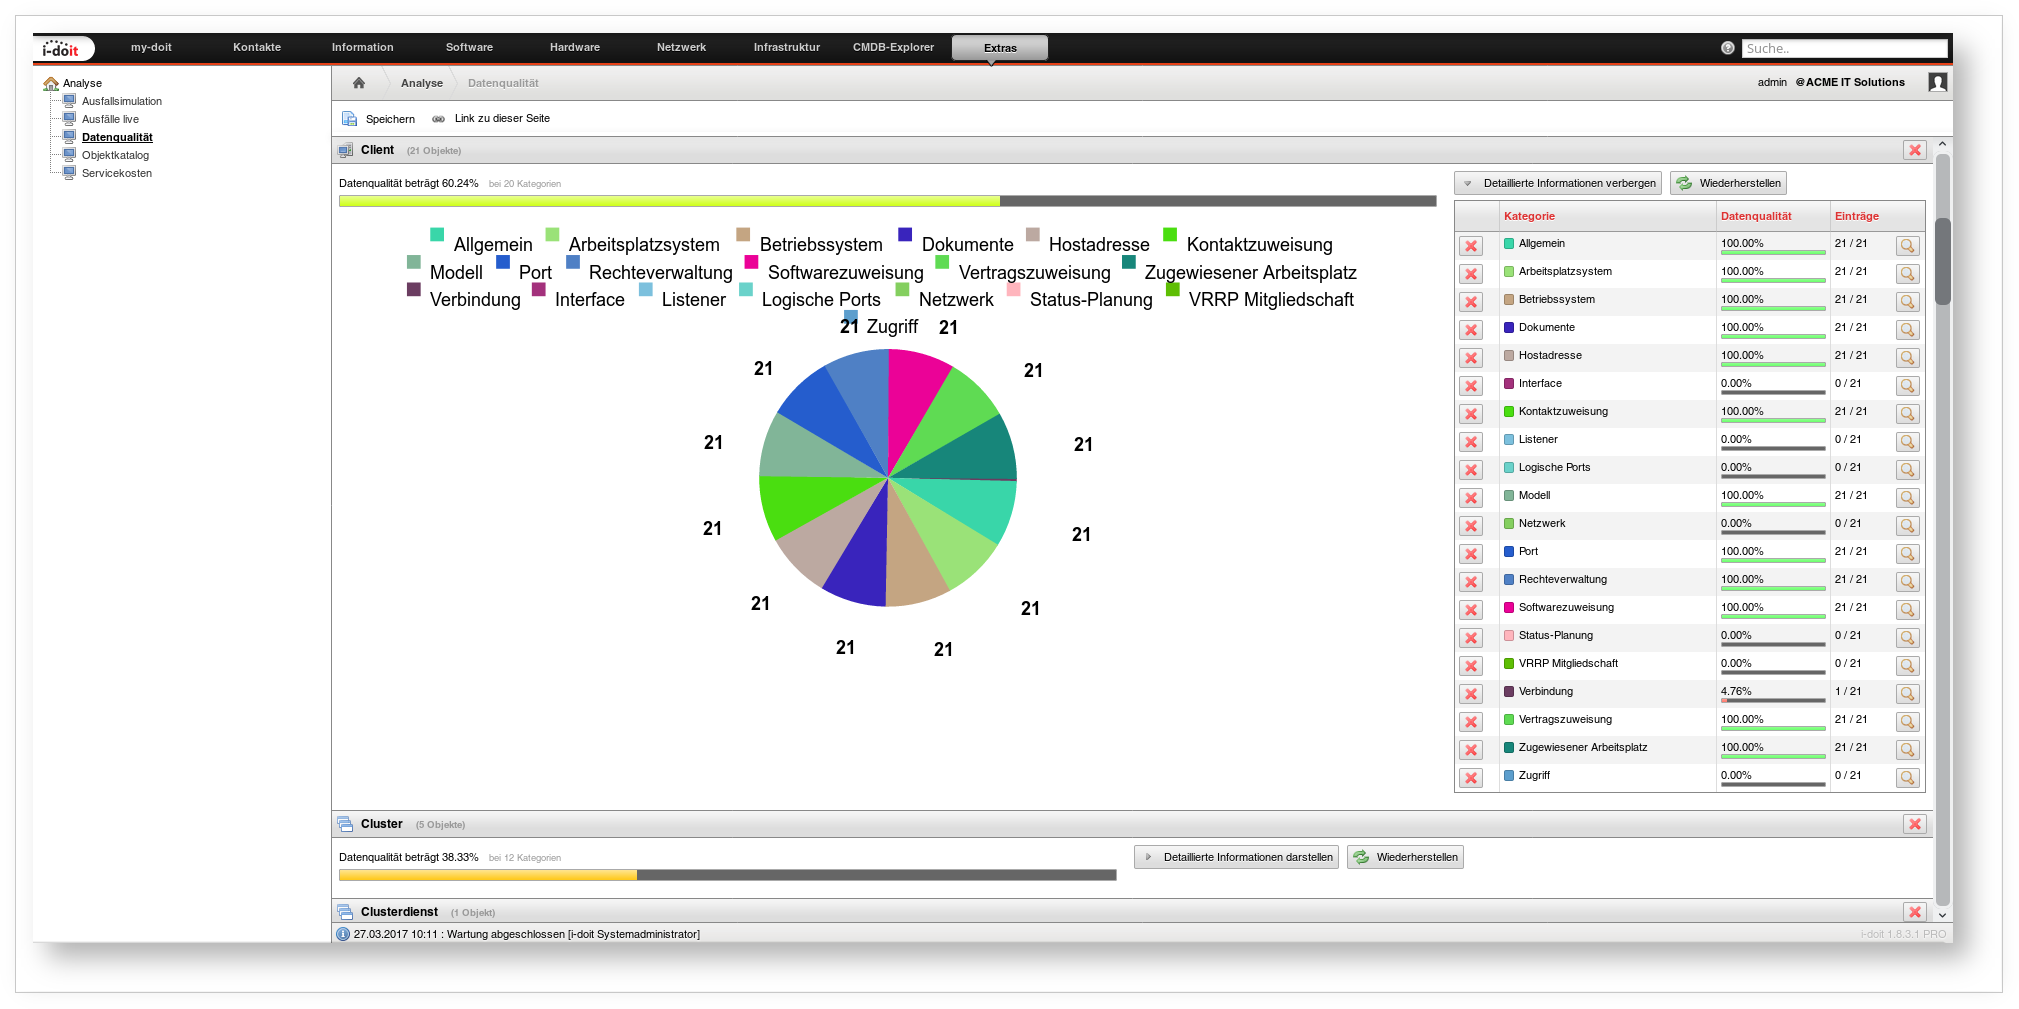
Under Extras → Analysis → Data quality, you measure how completely your IT documentation is filled in. The benchmark: Every assigned category of every object for each visible object type must be filled in -- that corresponds to 100 percent.
Example: You have 21 objects of the type Client with 20 assigned categories. Only when all categories are filled in for all 21 objects do you reach 100%. Every gap reduces the value.
Using the Show detailed information button, you can display details per object type. For gaps, you can generate a list of affected objects per category using the magnifying glass.
Object types or categories that distort the result can be hidden. The result is then recalculated.
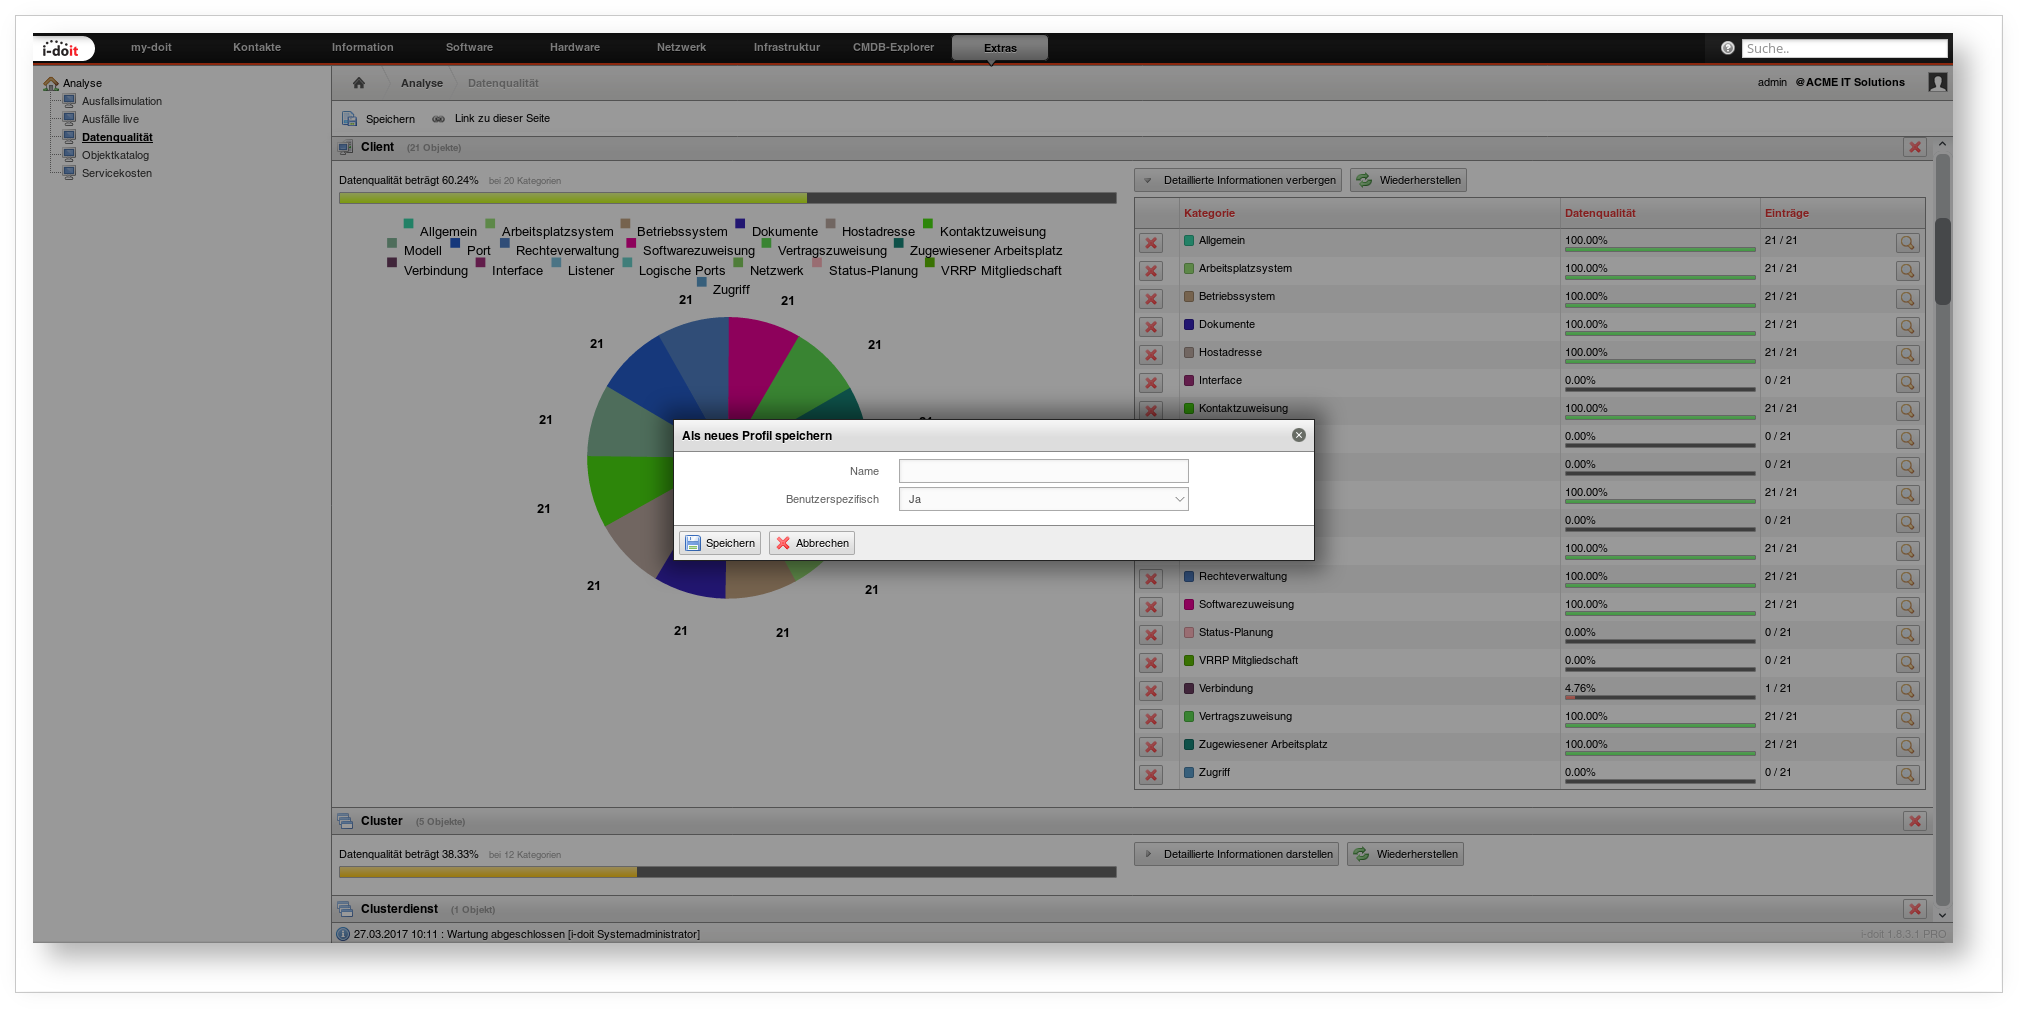
To save such adjustments as a profile:
- Click Save.
- Enter a meaningful title under Name.
- Under User-specific, specify whether only you or all users may use the profile.
Saved profiles appear in the left navigation tree below Data quality.
Object catalog#
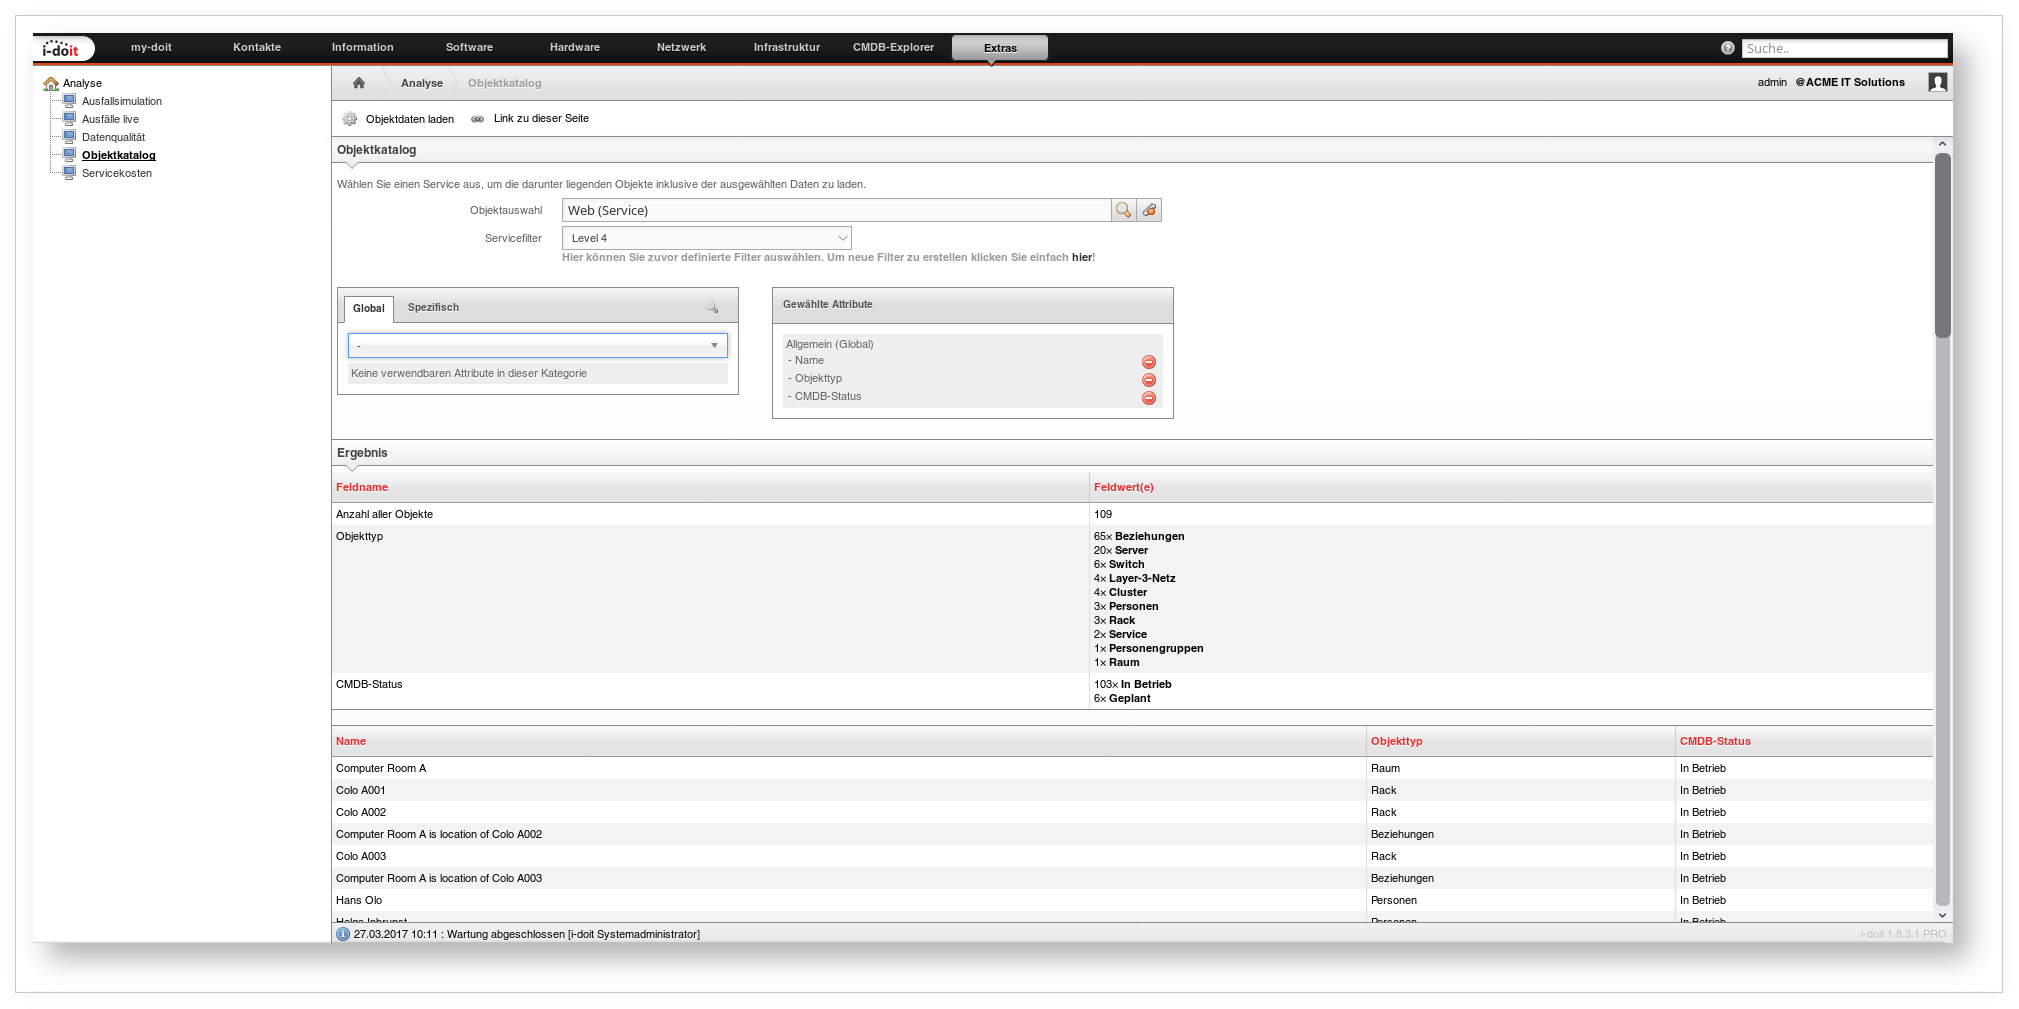
Under Extras → Analysis → Object catalog, you list all objects that belong to a service.
- Under Object selection, select an object of the type Service.
- Optionally narrow the analysis using the Service filter.
- Select the desired attributes from global and specific categories -- similar to the Report Manager.
- Click Load object data to generate the tabular result.
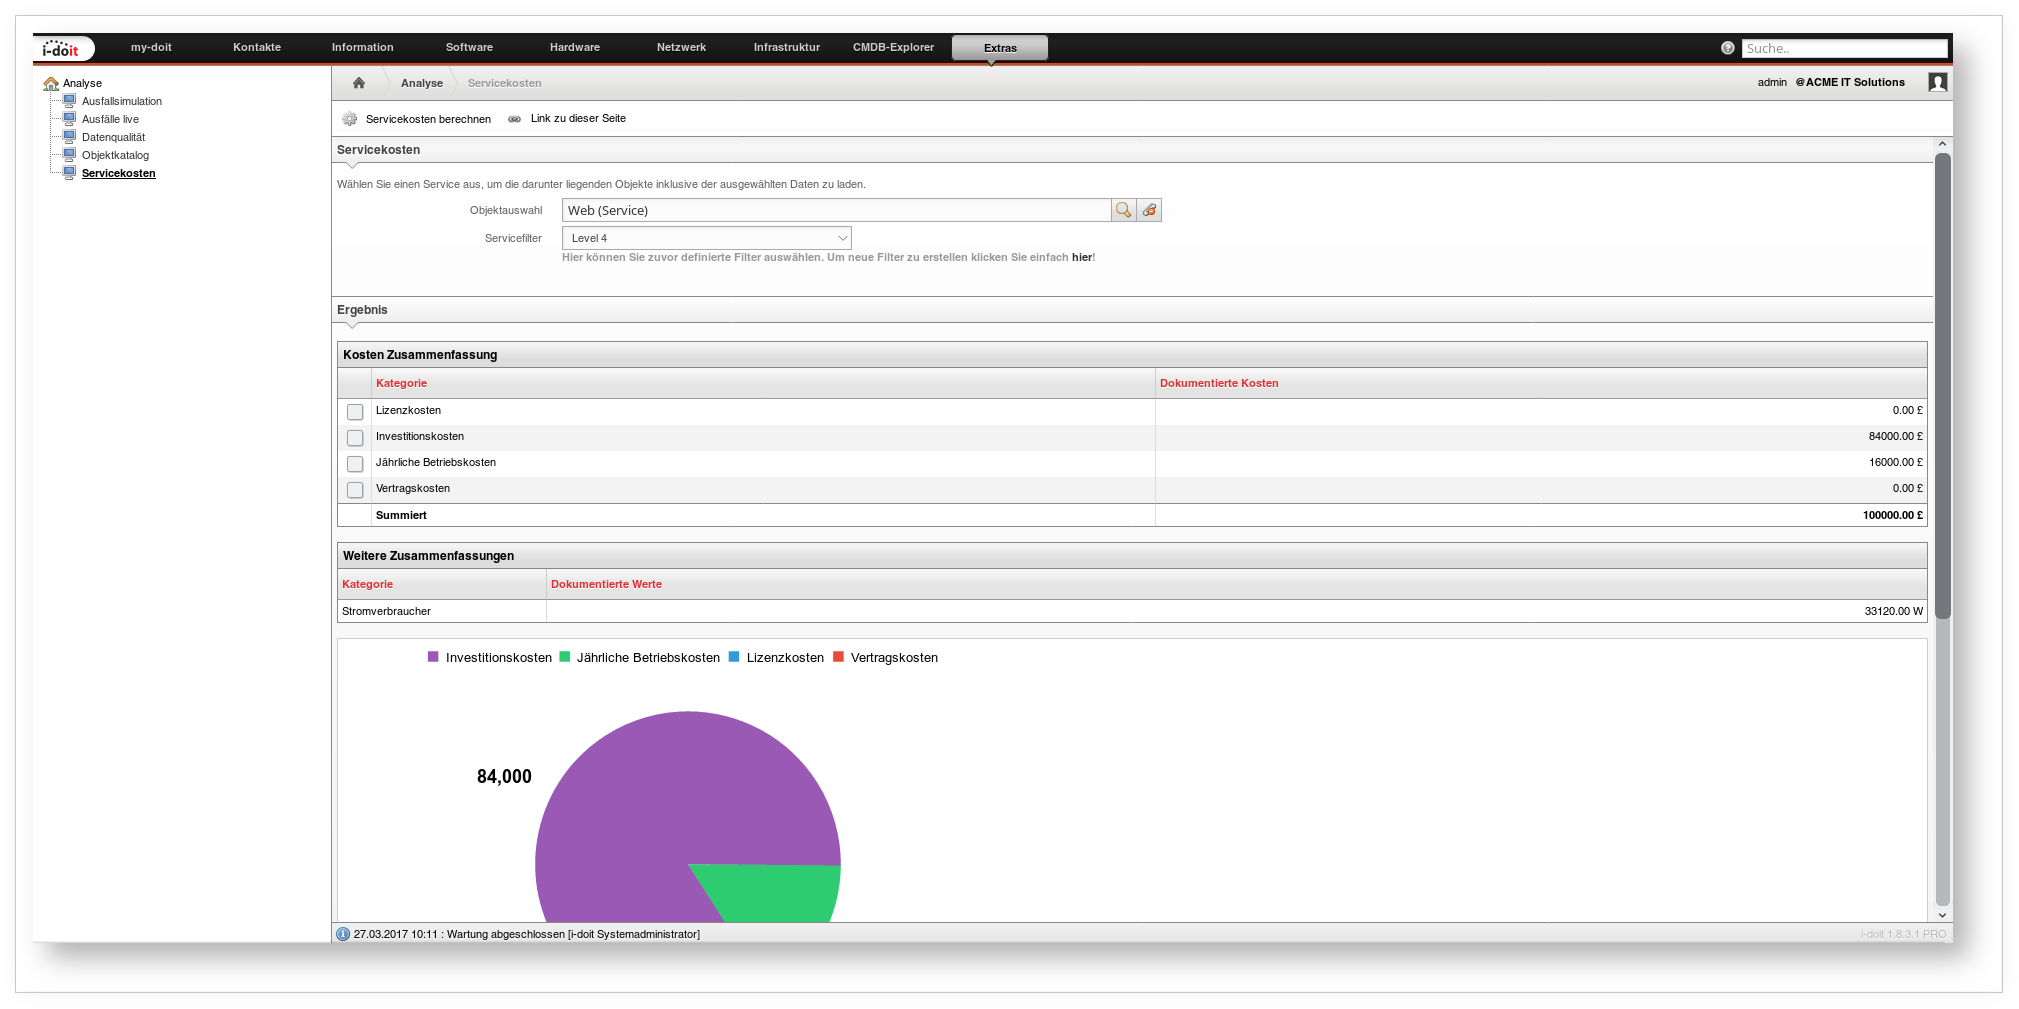
Service costs#
Under Extras → Analysis → Service costs, you calculate the costs of a service based on your IT documentation.
- Under Object selection, select an object of the type Service.
- Optionally narrow using the Service filter.
- Click Calculate service costs.
The Cost summary shows the following values:
| Category | Description |
|---|---|
| License costs | See category Software assignment |
| Investment costs | See category Accounting |
| Annual operating costs | See category Accounting |
| Contract costs | See category Contract assignment |
Under Further summaries, you can find the maximum energy consumption of hardware objects (category Power consumer).
Below that is a pie chart of the costs and a detailed breakdown per category and analyzed object.
Analysis category#
After activating the add-on, every object receives a category called Analysis. Via this category, you can go directly to the Outage simulation -- the respective object is already preselected.
Releases#
| Version | Date | Changelog |
|---|---|---|
| 1.5 | 27.02.20224 | [Task] PHP 8.2 compatibility, cleaned up color usage |
| 1.4 | 07.11.2023 | [Task] Use new routes to display object and object type images / move add-on related files |
| 1.3.1 | 22.08.2023 | [Improvement] PHP 8.1 Compatibility [Bug] Service assignment is not displayed in data quality [Bug] It is not possible to remove categories in data-quality profiles |
| 1.3 | 05.09.2022 | [Task] PHP 8.0 Compatibility [Task] Design Compatibility |
| 1.2 | 21.02.2022 | [Improvement] Dataquality on a report basis [Improvement] Implement API methods for the data quality report [Improvement] English add-on renaming to Analysis [Bug] Result In Objectcatalog Is Incomplete And Partially Incorrect |
| 1.1.4 | 20.10.2020 | [Bug] Missing option to add object types back into the data quality profiles after they were removed [Bug] Data quality is not evaluated correctly for user-defined categories |
| 1.1.3 | 04.05.2020 | [Bug] The "Report object selection" under "Failure simulation" must change the source for the reports. [Bug] Empty object types generate an SQL error in the data quality. [Bug] When opening data quality an SQL error is output |
| 1.1.2 | 05.07.2019 | [Bug] Impact simulation aborts with PHP fatal error |
| 1.1.1 | 05.12.2018 | [Improvement] PHP 7.2 compatibility [Improvement] Links in the outage simulation results should open in a new browser window [Bug] Object catalog: Attribute display is incorrect [Bug] Object "Persons" missing workstation assignment in detail view [Bug] No "Load object data" possible when no object was selected when clicking "Load object data" |
| 1.1 | 19.07.2018 | [Improvement] New visualization in data quality report [Change] Data quality does not display cable object type [Bug] "List objects without data" for custom categories leads to SQL error [Bug] Error when displaying detailed information in custom categories [Bug] Error message in new window after clicking object link in data quality |
| 1.0.5 | 31.07.2017 | [Improvement] Improve data quality performance [Improvement] New option for calculating total costs [Bug] Custom object icons are not scaled in data quality [Bug] Service costs use wrong currency symbol [Bug] Custom icons are displayed incorrectly. |
| 1.0.4 | 02.05.2017 | [Bug] Outage simulation timeout depending on database size |
| 1.0.3 | 08.03.2017 | [Change] Improved stability and performance in internal service tree evaluation [Bug] Calling service costs produces error [Bug] Custom categories are not evaluated [Bug] get_currency() error when executing the report view "Service costs" |
| 1.0.2 | 09.03.2015 | |
| 1.0.1 | 23.09.2014 | [Bug] Changing the weight of a relationship has no effect on the "outage severity". [Bug] Category "Network connections" always shows a data quality of 0%. [Bug] Category "Racks" always shows a data quality of 0%. |
| 1.0 | 20.08.2014 | Initial release |