Analysis#
The Analyse add-on primarily enables two implementations: On the one hand, it examines data quality and documentation quality and supplies an interactive result view stating the determined status. On the other hand, the add-on can be used as failure simulation. In this way, you can run through various "What happens if..." scenarios and analyse their impact on the infrastructure. With a combined use of the interface for the Checkmk monitoring solution, you also can directly examine live failures with regard to their effect.
Download and Installation#
You can install this add-on afterwards at any time. The "Add-ons" article provides detailed descriptions regarding download, installation, updates etc.
Configuration#
There is no provision for a separate configuration.
Rights Assignment#
You can set permissions for persons and person groups via Administration → Authorization system → Rights → Analyse.
| Condition | Description |
|---|---|
| Analytics | Execution of analyses |
| Manage the dataquality profiles | Create, edit profiles for Dataquality and/ or delete them irrevocably |
Impact Simulation#
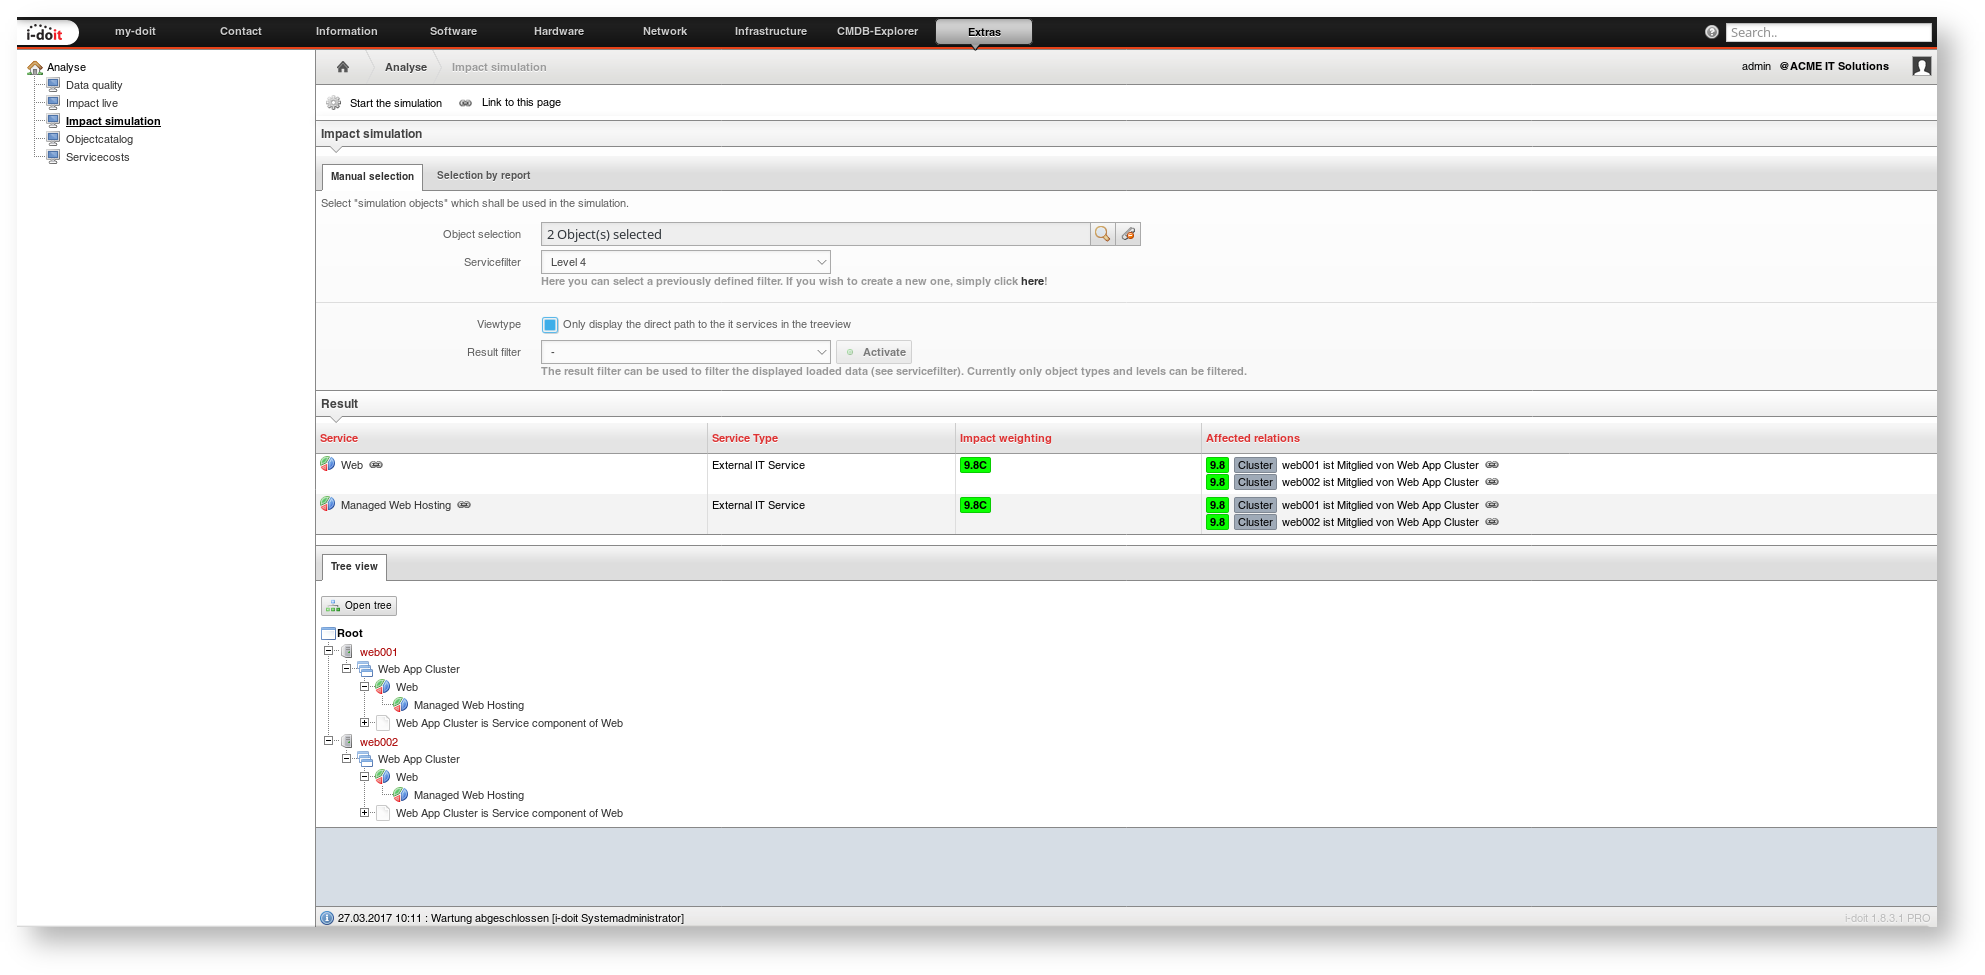
When you want to find out which consequences the failure of a certain object would have on documented services, you can use the appropriate simulation under Extras → Analyse → Impact simulation . With the tab for Manual selection you can select several options:
| Option | Description |
|---|---|
| Object selection | Selection of one or more objects which failed (or which you want to test as failed) |
| Servicefilter | Limitation of the analysis to a certain degree/depth, certain object types, object relations etc.; the configuration is under Extras → Services → Service filter. |
| Viewtype | Simplified representation of the Tree view |
| Result filter | Subsequent filtering |
After a click on the Start the simulation button, the result is displayed under the Options section: First there is a list of the services concerned. Also services which are on a higher level in the hierarchy may be listed here, depending on the selected Servicefilter . For each service, the Impact weighting is stated and represented in green (minor failure) or red (major failure) color depending on the degree of severity. The evaluation is carried out with emphasis on the affected object relations. If a “C” follows after the numeric field, the failed object is part of a cluster.
In order to visualize the failure, a service tree is built under Tree view.
With the tab called Selection by report you have the additional option to choose objects which are affected by a failure on the basis of a Report.
Impact Live#
One variant of the above described failure simulation is at *Extras → Analyse → Impact live*. Here i-doit refers to the interface of a configured Network Monitoring (for example, Checkmk). Target data which are to be analyzed become actual date. If a host really fails, you can now simulate which are the consequences of this failure with regard to the documented services.
Data Quality#
With the menu item Extras → Analyse → Data quality you can measure in what way the IT documentation is filled. The aspiration is that for each visible object type each assigned category of every object is filled in. This is the definition for the 100% target.
Example: There are 21 objects of the type Client. 20 categories are assigned to this object type. In order to reach the target of 100% all categories have to be filled in for all of the 21 objects. The percentage decreases for every missing detail.
You can display additional details for each object type with the button Show detailed information. In case of missing data, you can generate a list of the objects concerned for every category with the Magnifier function.
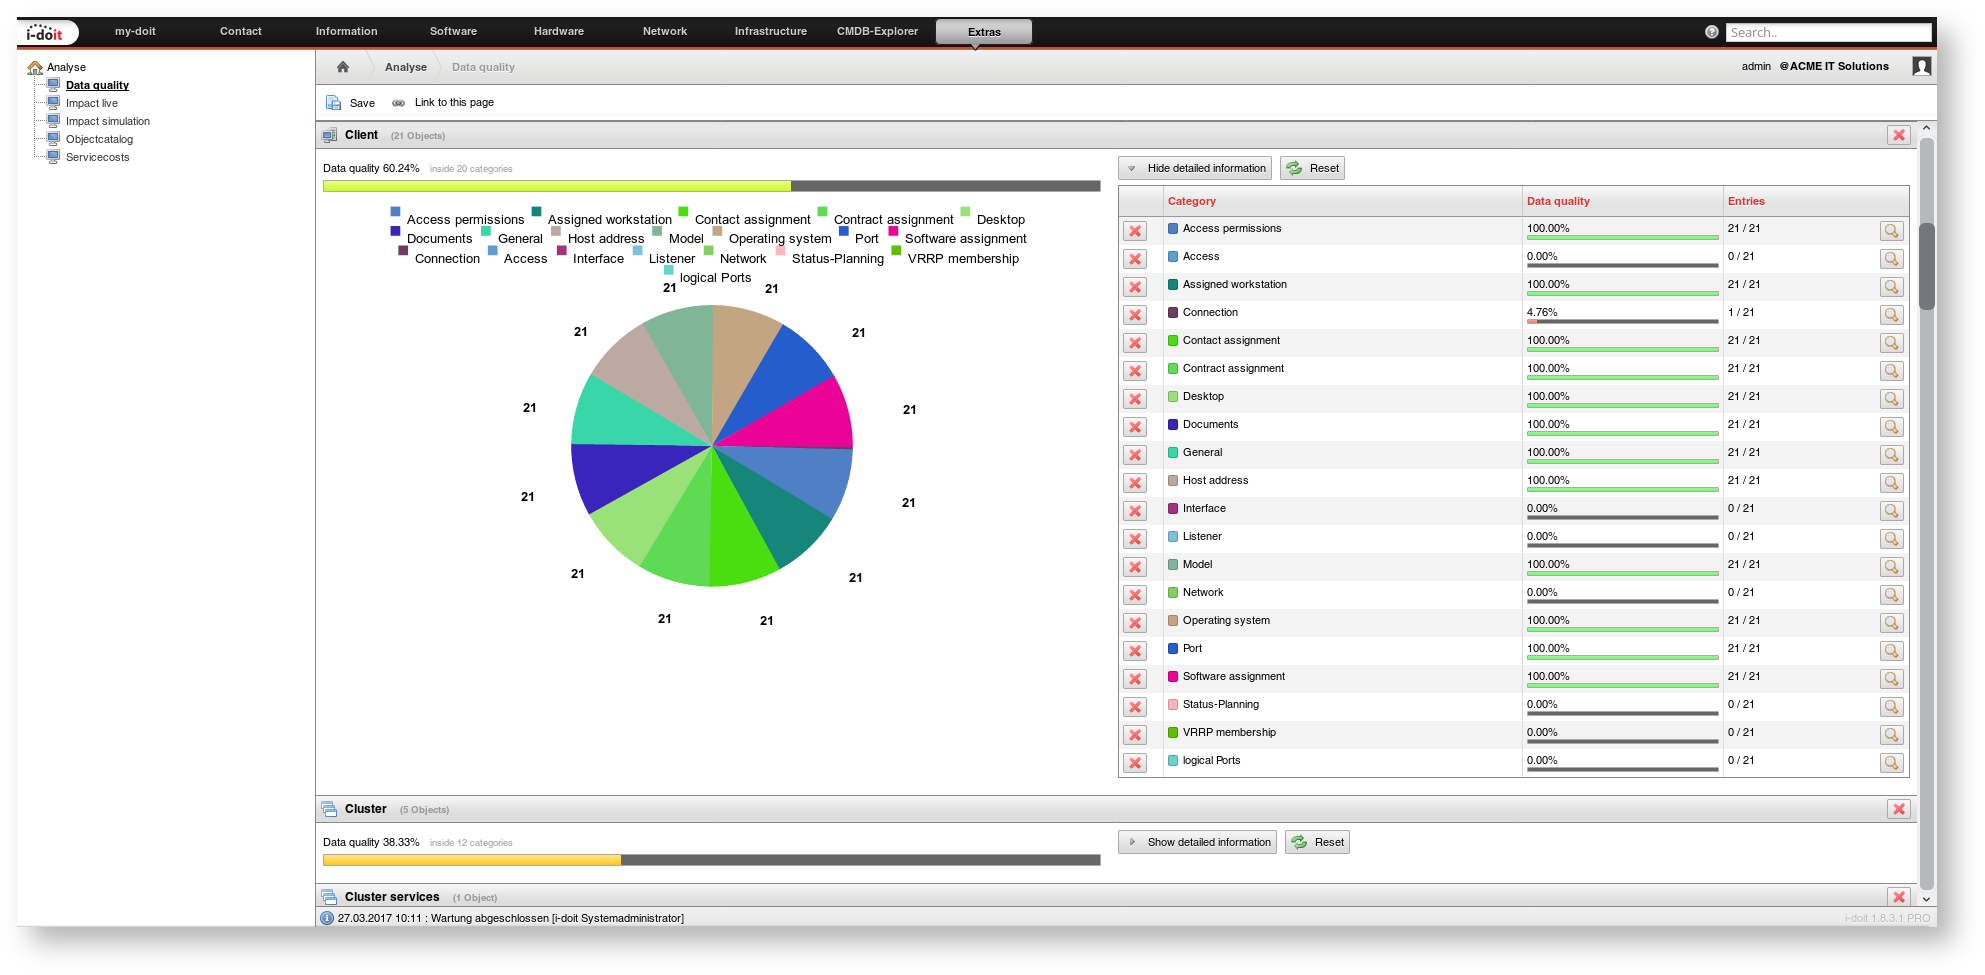
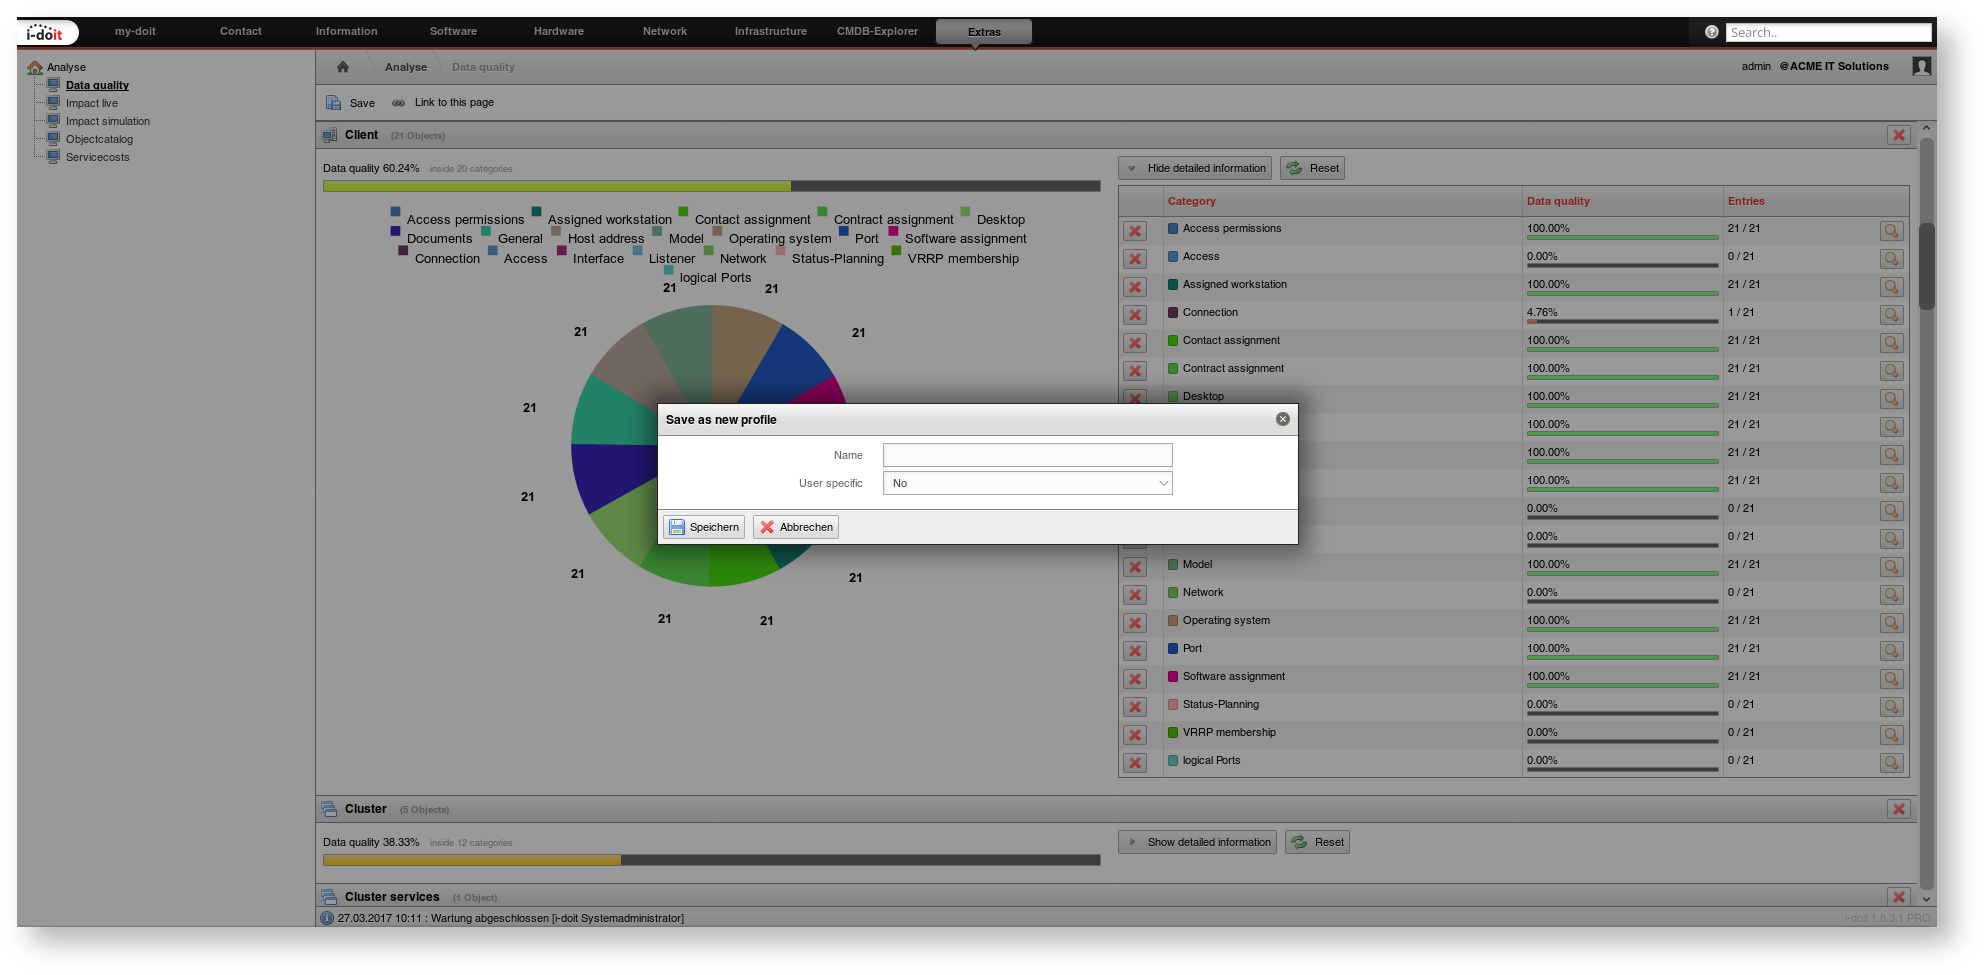
Should object types and/ or categories falsify the results, you can hide them. Then the result is recalculated. You can save these adjustments in profiles by clicking the Save button and reload them at any time. Choose a conclusive title under Name . In User specific you can determine whether only the respective user may load the profile or the profile is accessible for all users. Already saved profiles are shown in the left navigation tree under Data quality.
Object Catalog#
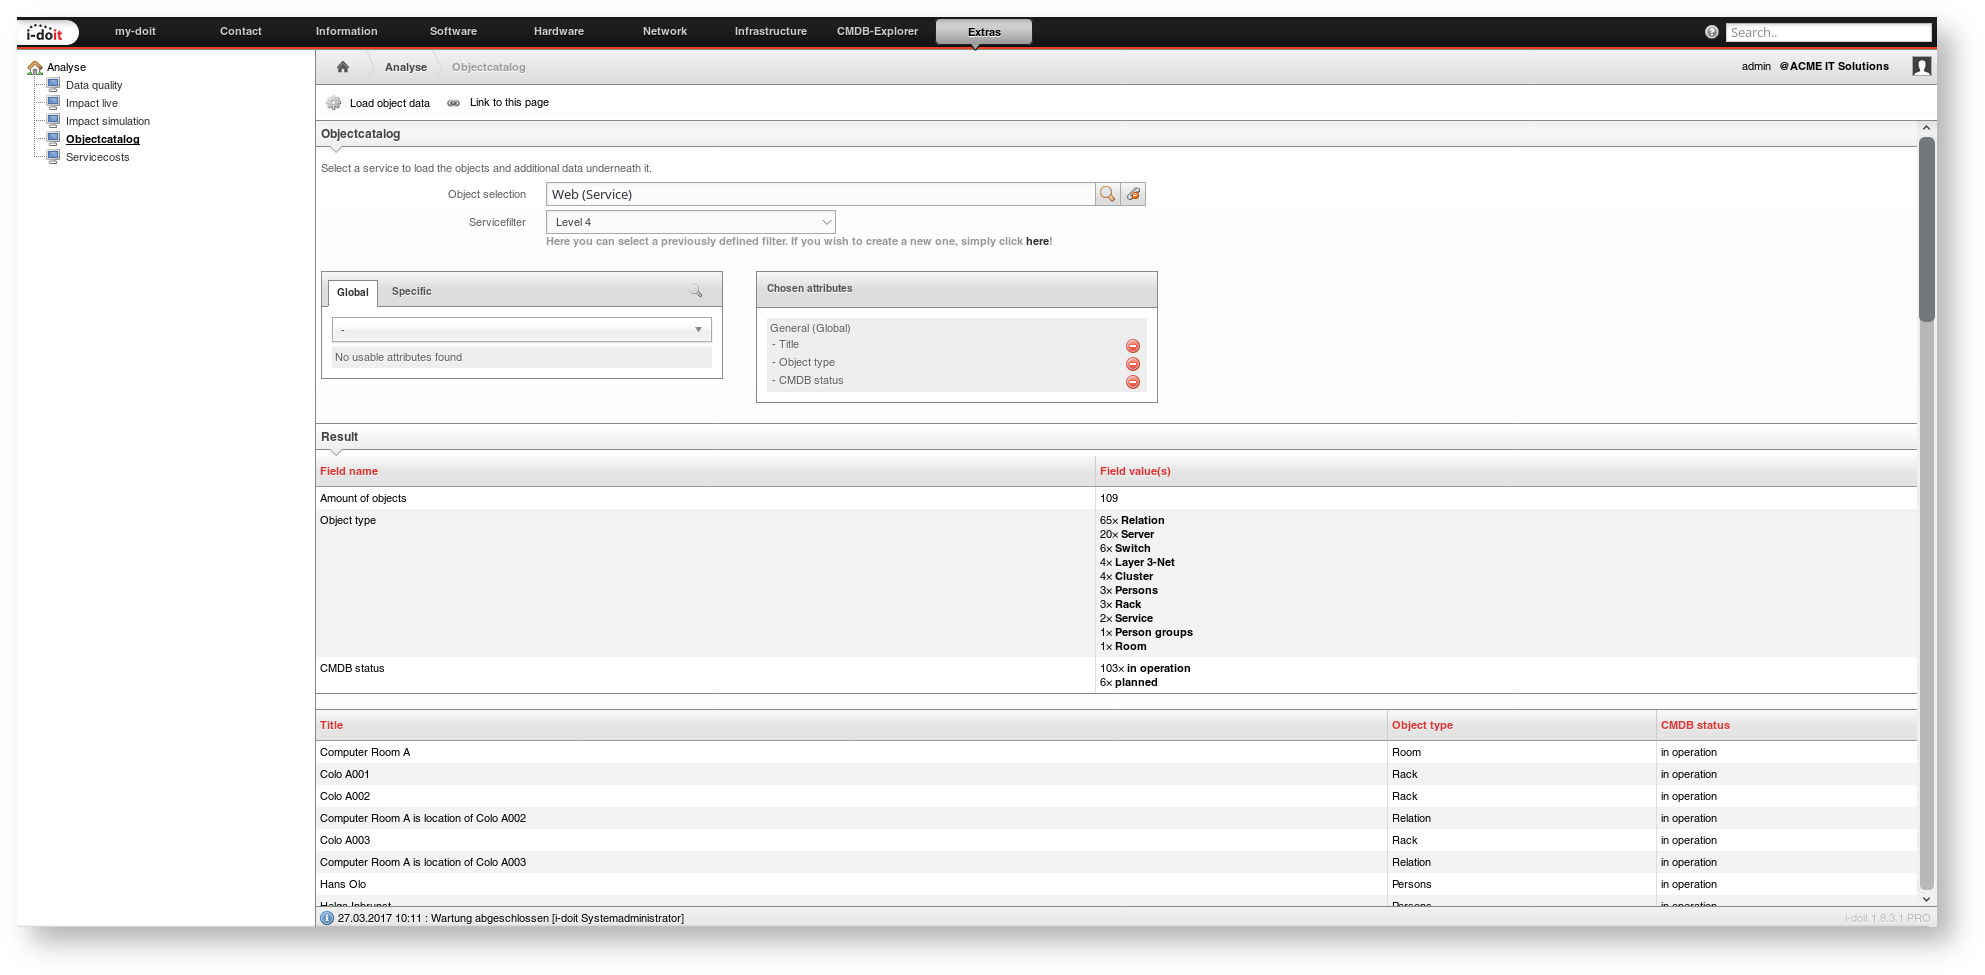
You can create a list showing you which objects belong to a service. With *Extras → Analyse → Objectcatalog you can choose an object of the type Service via Object selection . Then you limit the analysis optionally via the Service filter. Similar to the Report Manager you can vary the display of objects by selecting the matching attributes from global and specific categories. With a click on Load object data* the result is generated in a tabular overview.
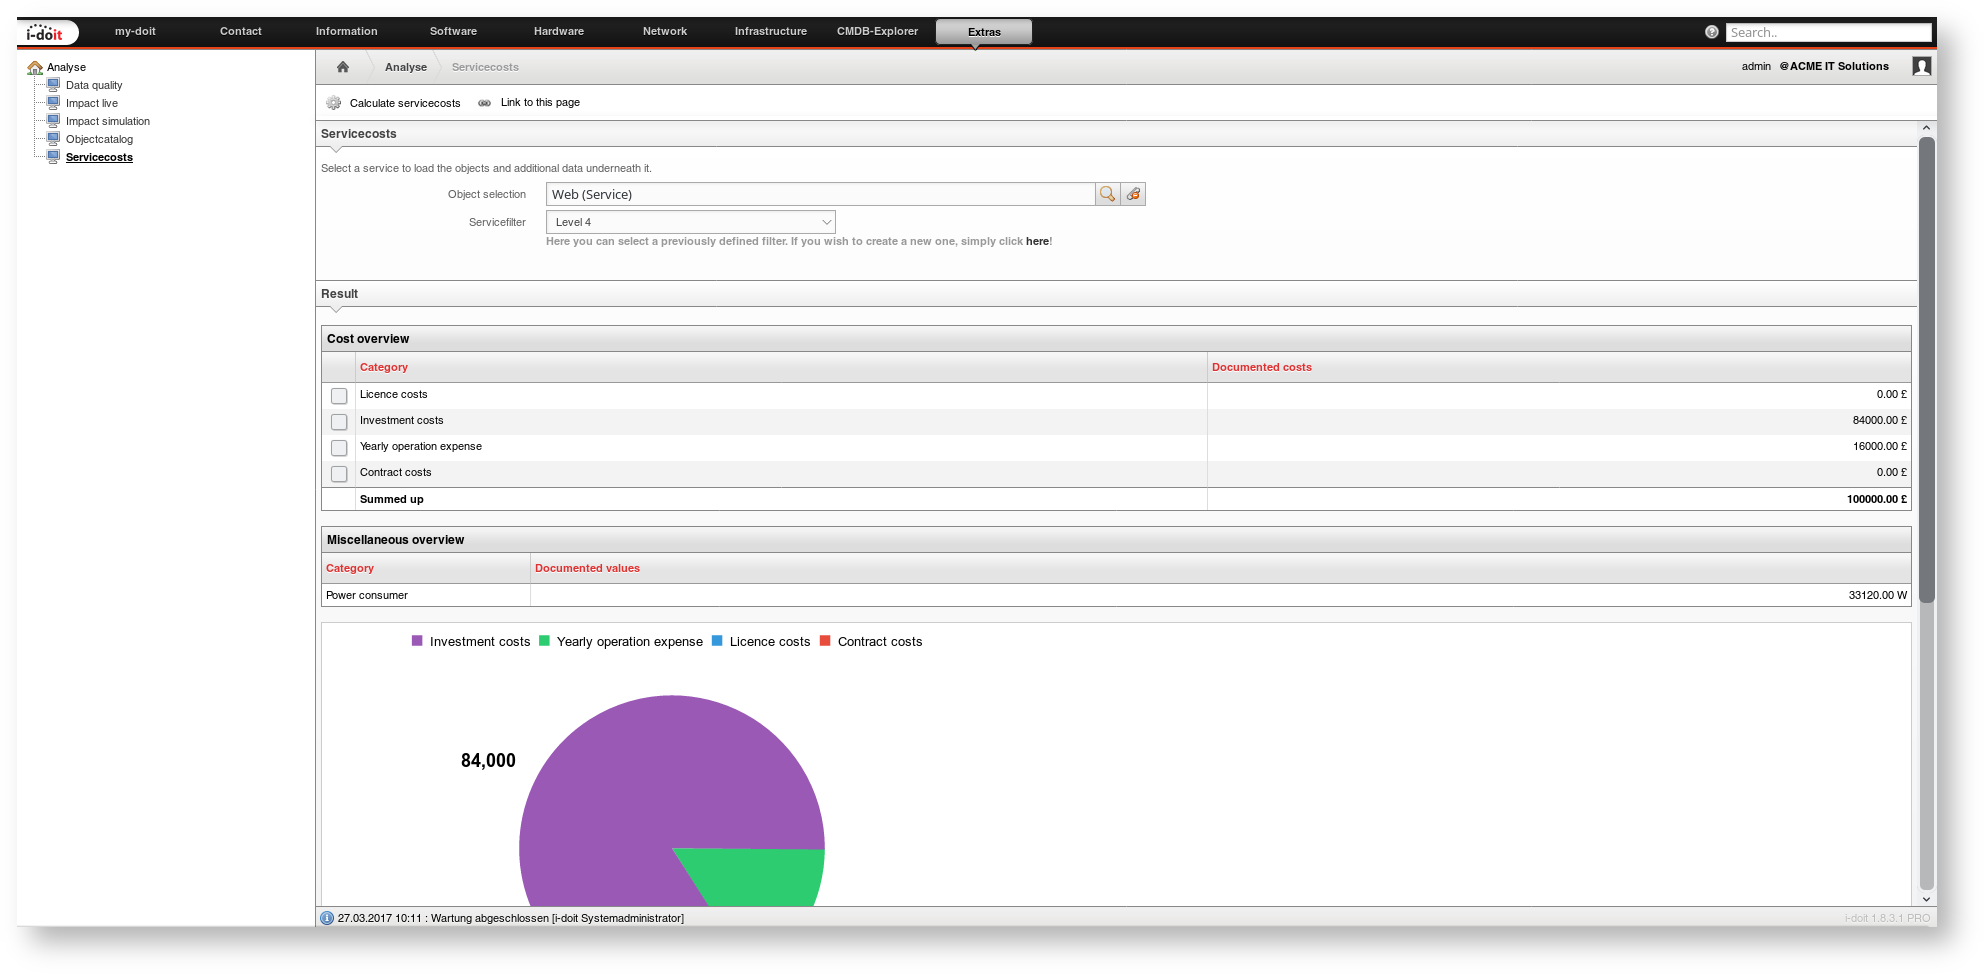
Service Costs
What are the costs for the performance of a given service? This question can be answered with Extras → Analyse → Servicecosts on basis of the IT documentation. At first you select an object of the type Service under Object selection. Then you limit the analysis optionally via the Servicefilter. By clicking the Calculate servicecosts button the data will be analyzed and prepared. The result is featured in a compressed overview via the Cost overview item.
| Category | Description |
|---|---|
| Licence costs | See category Software assignment |
| Investment costs | See category Accounting |
| Yearly operation expense | See category *Accounting* |
| Contract costs | See category Contract assignment |
The maximum energy demand of hardware objects is summarized in the section Miscellaneous overview (see category Power consumer).
Beside a pie chart illustrating the above mentioned costs, there is a detailed breakdown listing which data were evaluated per Category and analyzed object.
Analyse Category#
A category of the same name Analyse is assigned to each object after activation of the Analyse add-on. Via this category you can get directly to the Impact simulation, where the respective object is already preselected under Object selection.
Releases#
| Version | Date | Changelog |
|---|---|---|
| 1.5 | 2024-02-27 | [Task] PHP 8.2 compatibility, cleaned up color usage |
| 1.4 | 2023-11-07 | [Task] Use new routes to display object and object type images / move add-on related files |
| 1.3.1 | 2023-08.22 | [Improvement] PHP 8.1 Compatibility [Bug] Service assignment is not displayed in data quality [Bug] It is not possible to remove categories in data-quality profiles |
| 1.3 | 2022-09-05 | [Task] PHP 8.0 Compatibility [Task] Design Compatibility |
| 1.2 | 2022-02-21 | [Improvement] Dataquality on a report basis [Improvement] Implement API methods for the data quality report [Improvement] English add-on renaming to Analysis [Bug] Result In Objectcatalog Is Incomplete And Partially Incorrect |
| 1.1.4 | 2020-10-20 | [Bug] Missing option to add object types back into the data quality profiles after they were removed [Bug] Data quality is not evaluated correctly for user-defined categories |
| 1.1.3 | 2020-05-04 | [Bug] The "Report object selection" under "Failure simulation" must change the source for the reports. [Bug] Empty object types generate an SQL error in the data quality. [Bug] When opening data quality an SQL error is output |
| 1.1.2 | 2019-07-05 | [Bug] Impact simulation aborts with PHP fatal error |
| 1.1.1 | 2018-12-05 | [Verbesserung] PHP 7.2 Kompatibilität [Verbesserung] Links im Ergebnis der Ausfallsimulation sollten in einem neuen Browser-Fenster geöffnet werden [Bug] Objektkatalog: Anzeige der Attribute fehlerhaft [Bug] Objekt "Personen" fehlende Zuordnung von Arbeitsplätzen in der Detailansicht [Bug] Kein "Objektdaten laden" möglich, wenn bei Klick auf "Objektdaten laden" kein Objekt ausgewählt war |
| 1.1 | 2018-07-19 | [Improvement] New visuals in the data quality report [Change] Dataquality does not display object type cable [Bug] "Display objects without data" for custom categories leads to SQL error [Bug] Error displaying detailed information in custom categories [Bug] Error Message After Click On Object Link In Data Quality |
| 1.0.5 | 2017-07-31 | [Improvement] Increase the data quality performance [Improvement] New option for calculation of total costs [Bug] Size of object icons does not scale in data quality overview [Bug] Service costs use wrong currency [Bug] User defined icons are wrong displayed |
| 1.0.4 | 2017-05-02 | [Bug] When a impact simulation is executed, a timeout occurs depending on the size of the Database |
| 1.0.3 | 2017-03-08 | [Change] Improved stability and performance during the internal service tree evaluation [Bug] Invoking service costs shows defect note [Bug] Custom categories are not evaluated> [Bug] get_currency() Error executing report view "service costs" |
| 1.0.2 | 2015-03-09 | |
| 1.0.1 | 2014-09-23 | [Bug] Changing the weight of a relationship has no impact on failure seriousness [Bug] Category network connections shows a data quality of 0% at any time [Bug] Category rack shows a data quality of 0% at any time |
| 1.0 | 2014-08-20 | Initial release |